• Acta Optica Sinica
  • Vol. 42, Issue 8, 0814004 (2022)
Hui Tan*, Youxing Chen**, Yong Jin, Huaqi Chai, and Yajun Yang
Author Affiliations
  • School of Information and Communication Engineering, North University of China, Taiyuan, Shanxi 030051, China
  • show less
    DOI: 10.3788/AOS202242.0814004 Cite this Article Set citation alerts
    Hui Tan, Youxing Chen, Yong Jin, Huaqi Chai, Yajun Yang. Laser Ultrasonic Real-Time Monitoring Method for Solidification State of Butylated Hydroxy Lining[J]. Acta Optica Sinica, 2022, 42(8): 0814004 Copy Citation Text show less
    Cross-section view of lining bonding structure
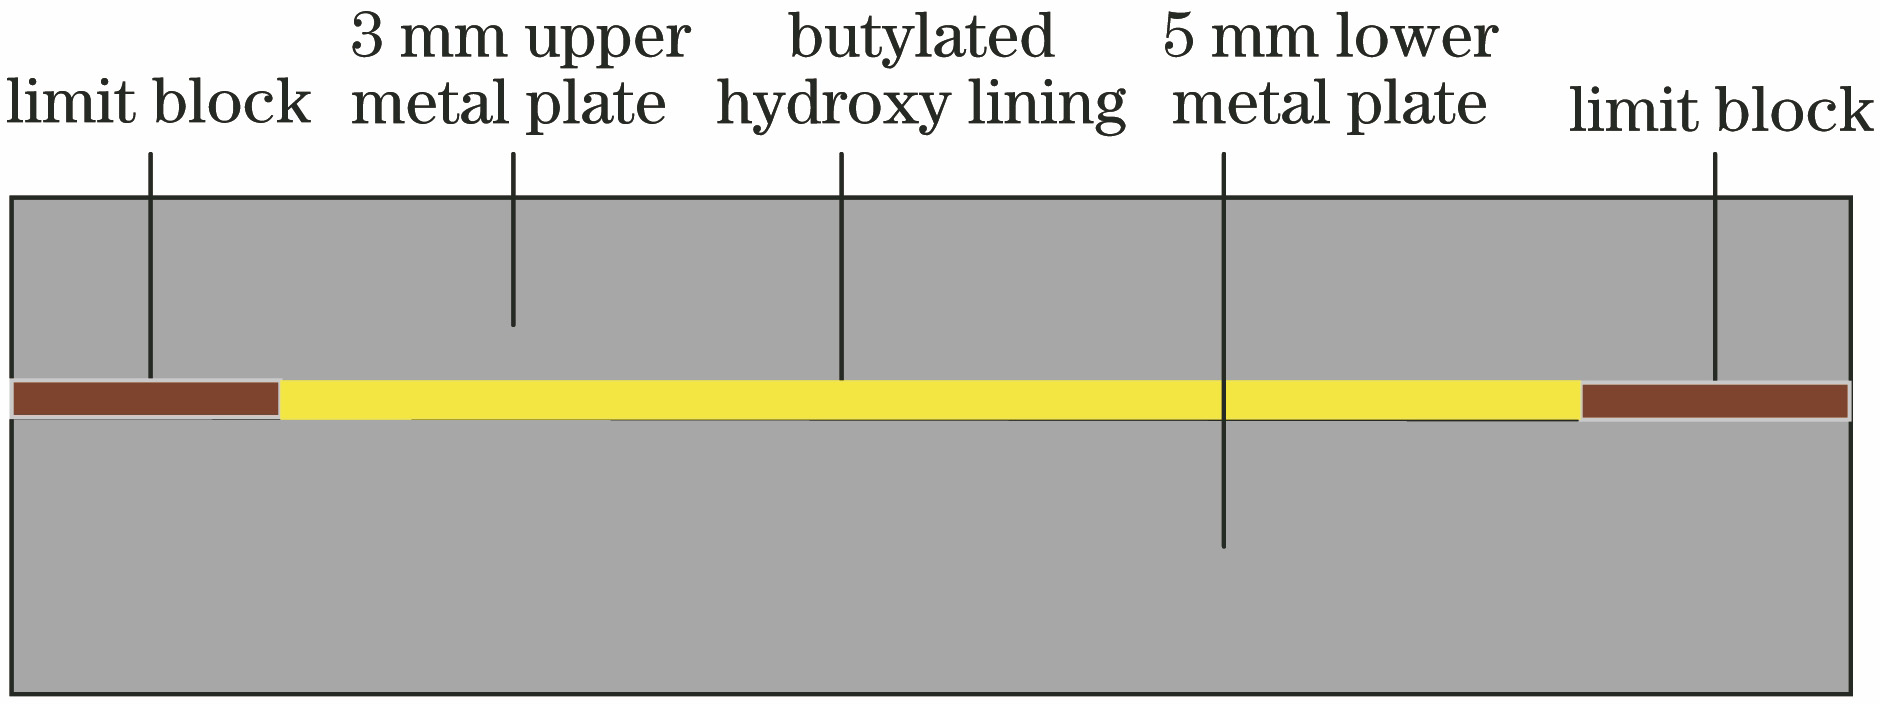
    Fig. 1. Cross-section view of lining bonding structure
    Experimental device for laser ultrasonic monitoring of lining solidification
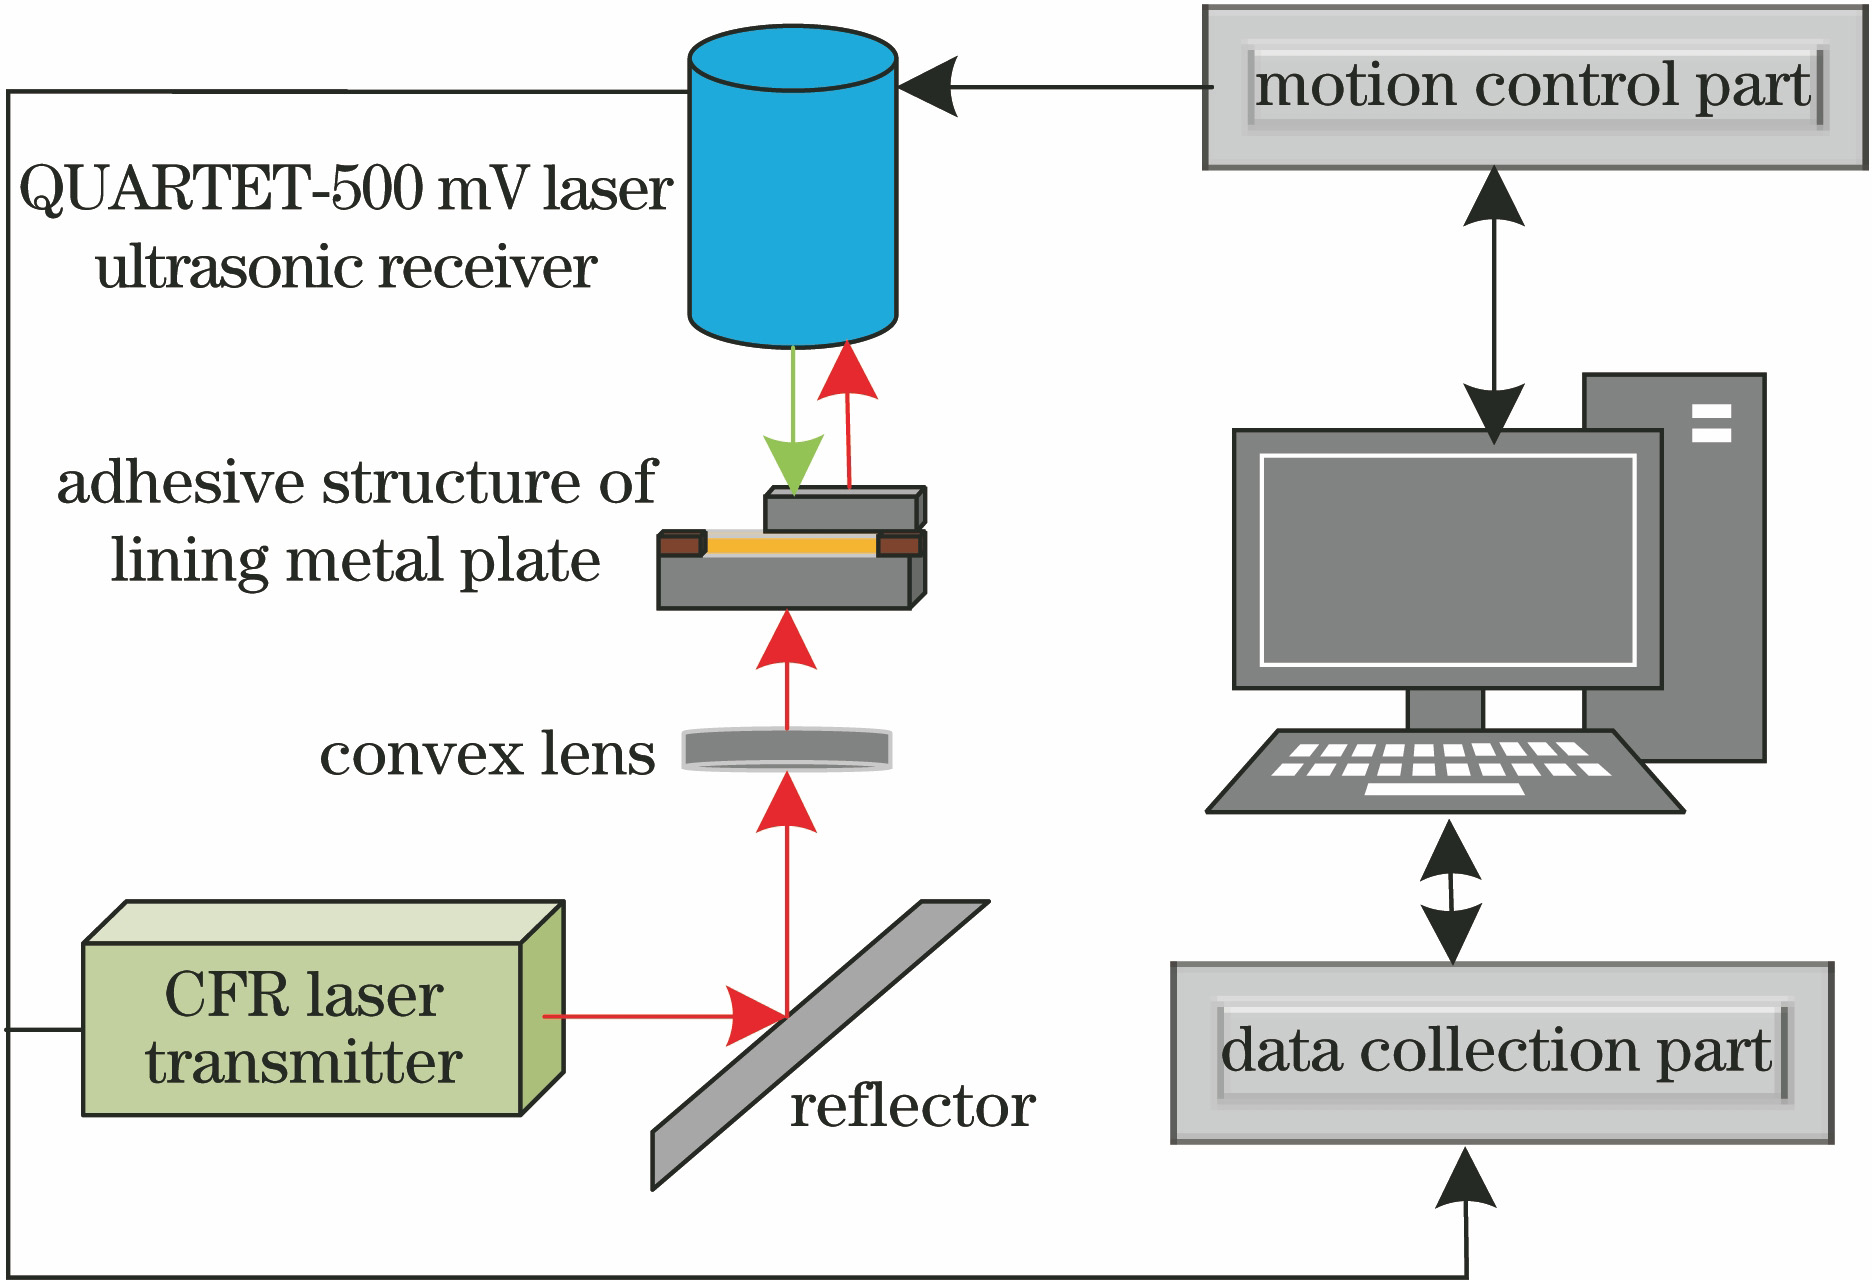
    Fig. 2. Experimental device for laser ultrasonic monitoring of lining solidification
    Propagation path of ultrasonic wave in specimen. (a) Echo paths for the first nine times; (b) path of echo Ⅰ; (c) path of echo Ⅱ; (d) path of echo Ⅲ; (e) path of echo Ⅴ
    Fig. 3. Propagation path of ultrasonic wave in specimen. (a) Echo paths for the first nine times; (b) path of echo Ⅰ; (c) path of echo Ⅱ; (d) path of echo Ⅲ; (e) path of echo Ⅴ
    Propagation path of ultrasonic wave in bonding structure of metal plate lining. (a) Simulation cloud image of ultrasonic entering metal plate with thickness of 5 mm; (b) simulation cloud image of ultrasonic entering metal plate with thickness of 1.5 mm; (c) simulation cloud image of ultrasonic entering metal plate with thickness of 3 mm
    Fig. 4. Propagation path of ultrasonic wave in bonding structure of metal plate lining. (a) Simulation cloud image of ultrasonic entering metal plate with thickness of 5 mm; (b) simulation cloud image of ultrasonic entering metal plate with thickness of 1.5 mm; (c) simulation cloud image of ultrasonic entering metal plate with thickness of 3 mm
    Detection point and A-scan signal in bonding structure of metal plate lining. (a) Detection point in bonding structure; (b) A-scan signal at detection point
    Fig. 5. Detection point and A-scan signal in bonding structure of metal plate lining. (a) Detection point in bonding structure; (b) A-scan signal at detection point
    Simulated cloud images of the first nine echo arrival times. (a) Echo Ⅰ; (b) echo Ⅱ; (c) echo Ⅲ; (d) echo Ⅳ; (e) echo Ⅴ; (f) echo Ⅵ; (g) echo Ⅶ; (h) echo Ⅷ; (i) echo Ⅸ
    Fig. 6. Simulated cloud images of the first nine echo arrival times. (a) Echo Ⅰ; (b) echo Ⅱ; (c) echo Ⅲ; (d) echo Ⅳ; (e) echo Ⅴ; (f) echo Ⅵ; (g) echo Ⅶ; (h) echo Ⅷ; (i) echo Ⅸ
    Laser ultrasonic monitoring of typical signal of lining solidification. (a) Time domain diagram of typical signal of aluminum lining bonding structure; (b) frequency domain diagram of typical signal of aluminum lining bonding structure; (c) time domain diagram of typical signal of steel plate lining bonding structure; (d) frequency domain diagram of typical signal of steel plate lining bonding structure
    Fig. 7. Laser ultrasonic monitoring of typical signal of lining solidification. (a) Time domain diagram of typical signal of aluminum lining bonding structure; (b) frequency domain diagram of typical signal of aluminum lining bonding structure; (c) time domain diagram of typical signal of steel plate lining bonding structure; (d) frequency domain diagram of typical signal of steel plate lining bonding structure
    Components of echo I arrival time
    Fig. 8. Components of echo I arrival time
    Propagation principle of ultrasonic wave
    Fig. 9. Propagation principle of ultrasonic wave
    Variation curves of Z2 with different variables. (a) Variation curve of Z2 with A; (b) variation curve of k with D
    Fig. 10. Variation curves of Z2 with different variables. (a) Variation curve of Z2 with A; (b) variation curve of k with D
    Echo I signal of lining in different states. (a) Echo Ⅰ signal of aluminum lining bonding structure; (b) echo Ⅰ signal of steel plate lining bonding structure
    Fig. 11. Echo I signal of lining in different states. (a) Echo Ⅰ signal of aluminum lining bonding structure; (b) echo Ⅰ signal of steel plate lining bonding structure
    Frequency domain diagram of echo Ⅰ signal in different states of lining. (a) Frequency domain diagram of echo Ⅰ signal of aluminum lining bonding structure; (b) frequency domain diagram of echo Ⅰ signal of steel plate lining bonding structure
    Fig. 12. Frequency domain diagram of echo Ⅰ signal in different states of lining. (a) Frequency domain diagram of echo Ⅰ signal of aluminum lining bonding structure; (b) frequency domain diagram of echo Ⅰ signal of steel plate lining bonding structure
    B-scan of echo I. (a) B-scan of echo I of aluminum lining bonding structure; (b) B-scan of echo I of steel plate lining bonding structure
    Fig. 13. B-scan of echo I. (a) B-scan of echo I of aluminum lining bonding structure; (b) B-scan of echo I of steel plate lining bonding structure
    Material
    1060 aluminum2.503.444.064.385.005.325.625.946.26
    201 steel2.503.504.204.505.205.525.886.206.54
    Table 1. Arrival time of the first nine echoesunit: μs
    Lining stateAluminum lining bonding structureSteel plate lining bonding structure
    Echo Ⅰ arrival time /μsUltrasonic transit time /μsUltrasonic speed /(m·s-1)Relative sound attenuation /NpEcho Ⅰ arrival time /μsUltrasonic transit time /μsUltrasonic speed /(m·s-1)Relative sound attenuation /Np
    Drawing state2.520.8716090.56--0.602.500.8116050.71--0.76
    Semi-cured state2.500.8516470.51--0.562.480.7916460.68--0.71
    Fully-cured state2.480.8316870.46--0.512.460.7716880.66--0.68
    Table 2. Characteristic parameters of lining in different states
    Hui Tan, Youxing Chen, Yong Jin, Huaqi Chai, Yajun Yang. Laser Ultrasonic Real-Time Monitoring Method for Solidification State of Butylated Hydroxy Lining[J]. Acta Optica Sinica, 2022, 42(8): 0814004
    Download Citation