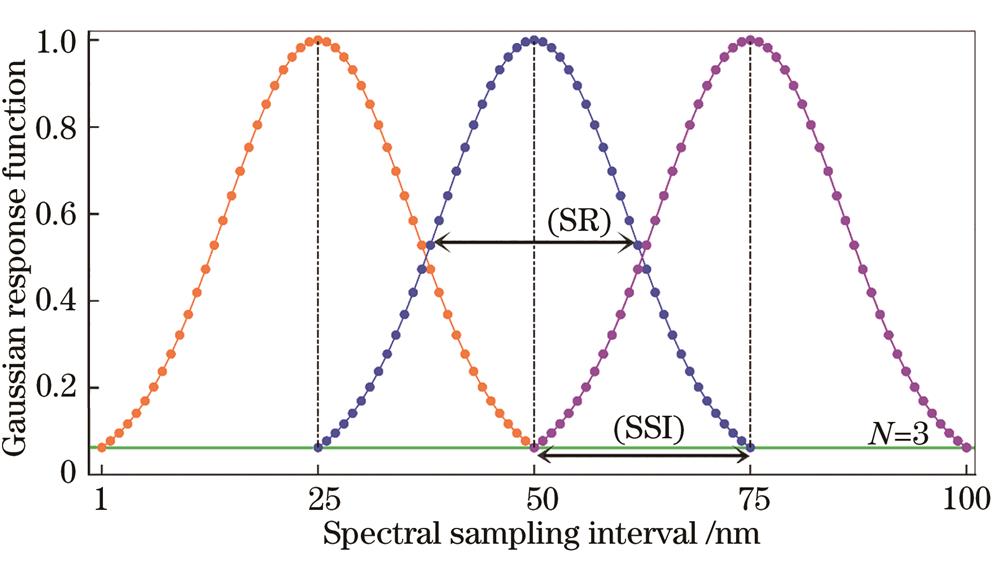
Fig. 1. Gaussian response function when N=3, RSR=25 nm, ISSI=25 nm
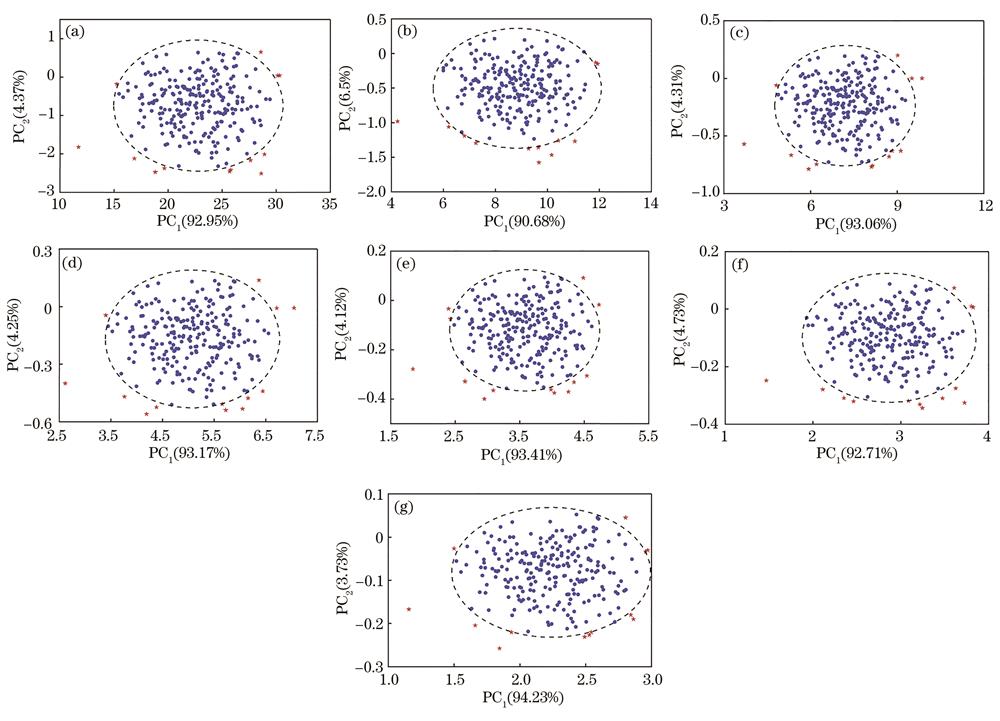
Fig. 2. Principal component projections of 255 samples for different spectral configurations. (a) ASD_1/1; (b) Con_3/10; (c) Con_10/10; (d) Con_20/20; (e) Con_40/40; (f) Con_60/60; (g) Con_100/100
Fig. 3. Soil characteristic box diagram of each spectral configuration after excluding outliers and the corresponding descriptive statistics. (a)‒(c) SOM Min, Mean, Max, Std, CV, Ske of entire, calibration, and validation datasets; (d)‒(f) EC Min, Mean, Max, Std, CV, Ske of entire, calibration, and validation datasets
Fig. 4. Soil reflectance spectra. (a) SOM with different content; (b) EC with different content
Fig. 5. Comparison of operation accuracy and operation time between SOM and EC under different band combinations.(a) SOM; (b) EC
Fig. 6. Scatter plots of soil characteristics and measured values simulated by different PLSR models. (a)(b) Optimal spectra; (c)(d) full-band spectra
Fig. 7. VIP values obtained from different PLSR models, best spectral parameters used as predictors to estimate soil properties. (a) SOM; (b) EC
| Configuration | N | 400‒1000 nm | 1000‒2400 nm |
|---|
| SSI | SR | SSI | SR |
|---|
| ASD_1/1 | 2001 | 1 | 3 | 1 | 10 | | Con_3/10 | 339 | 3 | 3 | 10 | 10 | | Con_10/10 | 199 | 10 | 10 | 10 | 10 | | Con_20/20 | 99 | 20 | 20 | 20 | 20 | | Con_40/40 | 49 | 40 | 40 | 40 | 40 | | Con_60/60 | 32 | 60 | 60 | 60 | 60 | | Con_100/100 | 19 | 100 | 100 | 100 | 100 |
|
Table 1. Description of 7 spectral configurations
| Configuration | Spectral variable | Maximum determination coefficient(R2)calibration/validation |
|---|
| ASD_1/1 | TBI1(R2170,R1883,R2322) | TBI2(R404,R612,R552) | TBI3(R1876,R2170,R847) | TBI4(R1419,R2379,R916) | TBI5(R1880,R653,R2170) | 0.62/0.58 | 0.59/0.34 | 0.68/0.65 | 0.68/0.69 | 0.65/0.64 | | Con_3/10 | TBI1(R1780,R1480,R1760) | TBI2(R404,R641,R587) | TBI3(R1480,R1770,R608) | TBI4(R1010,R1860,R959) | TBI5(R1480,R1770,R722) | 0.63/0.58 | 0.61/0.36 | 0.68/0.67 | 0.66/0.64 | 0.65/0.65 | | Con_10/10 | TBI1(R1880,R2170,R1910) | TBI2(R410,R620,R570) | TBI3(R1880,R2170,R750) | TBI4(R1420,R2380,R930) | TBI5(R1880,R2170,R620) | 0.62/0.58 | 0.59/0.34 | 0.67/0.68 | 0.67/0.56 | 0.64/0.65 | | Con_20/20 | TBI1(R1880,R2180,R2320) | TBI2(R420,R600,R580) | TBI3(R1880,R2180,R620) | TBI4(R1420,R2380,R940) | TBI5(R1880,R680,R2180) | 0.62/0.63 | 0.59/0.42 | 0.66/0.69 | 0.66/0.64 | 0.64/0.59 | | Con_40/40 | TBI1(R1880,R2160,R1840) | TBI2(R440,R600,R660) | TBI3(R1400,R2160,R960) | TBI4(R1400,R2240,R1080) | TBI5(R1400,R960,R2160) | 0.51/0.56 | 0.47/0.34 | 0.56/0.54 | 0.58/0.54 | 0.53/0.54 | | Con_60/60 | TBI1(R2270,R1910,R650) | TBI2(R470,R650,R590) | TBI3(R950,R2210,R1490) | TBI4(R1490,R2330,R1130) | TBI5(R890,R2210,R1490) | 0.34/0.3 | 0.41/0.15 | 0.49/0.42 | 0.48/0.43 | 0.47/0.41 | | Con_100/100 | TBI1(R1400,R700,R2300) | TBI2(R1400,R700,R600) | TBI3(R1800,R1900,R2200) | TBI4(R1400,R2300,R800) | TBI5(R1500,R600,R500) | 0.32/0.1 | 0.35/0.13 | 0.41/0.2 | 0.53/0.27 | 0.38/0.06 |
|
Table 2. Best frequency-spectrum parameters of SOM in each spectral configuration derived from optimal band combination algorithm
| Configuration | Spectral variable | Maximum determination coefficient(R2)calibration/validation |
|---|
| ASD_1/1 | TBI1(R2292,R2355,R634) | TBI2(R826,R2069,R698) | TBI3(R803,R1099,R2169) | TBI4(R2364,R2316,R2241) | TBI5(R2179,R2134,R2102) | 0.33/0.27 | 0.58/0.5 | 0.42/0.54 | 0.37/0.26 | 0.37/0.34 | | Con_3/10 | TBI1(R1960,R1890,R1970) | TBI2(R750,R1480,R1380) | TBI3(R1920,R950,R893) | TBI4(R1960,R1910,R1850) | TBI5(R728,R1730,R413) | 0.29/0.37 | 0.6/0.61 | 0.47/0.51 | 0.3/0.39 | 0.32/0.16 | | Con_10/10 | TBI1(R2290,R2360,R690) | TBI2(R1110,R2310,R620) | TBI3(R2180,R1150,R890) | TBI4(R2360,R2320,R2220) | TBI5(R2180,R2130,R2100) | 0.33/0.26 | 0.58/0.5 | 0.44/0.55 | 0.36/0.25 | 0.36/0.37 | | Con_20/20 | TBI1(R2280,R2360,R660) | TBI2(R940,R2120,R580) | TBI3(R2120,R1080,R760) | TBI4(R2360,R2320,R2220) | TBI5(R2180,R2140,R2100) | 0.31/0.26 | 0.57/0.5 | 0.42/0.51 | 0.34/0.26 | 0.35/0.3 | | Con_40/40 | TBI1(R2280,R2360,R640) | TBI2(R760,R2280,R640) | TBI3(R2120,R1080,R760) | TBI4(R2360,R2320,R2280) | TBI5(R2280,R2160,R1800) | 0.3/0.31 | 0.57/0.51 | 0.4/0.45 | 0.29/0.28 | 0.26/0.22 | | Con_60/60 | TBI1(R2270,R2210,R2030) | TBI2(R1430,R2210,R2210) | TBI3(R1370,R1490,R1070) | TBI4(R2270,R2150,R1910) | TBI5(R1010,R2210,R470) | 0.11/0.15 | 0.56/0.62 | 0.38/0.41 | 0.11/0.28 | 0.22/0.13 | | Con_100/100 | TBI1(R1800,R2200,R600) | TBI2(R1200,R2300,R1900) | TBI3(R1300,R2200,R1400) | TBI4(R1300,R2300,R900) | TBI5(R1900,R2100,R1800) | 0.21/0.12 | 0.54/0.56 | 0.38/0.21 | 0.2/0.04 | 0.25/0.11 |
|
Table 3. Best frequency-spectrum parameters of EC in each spectral configuration derived from optimal band combination algorithm
| Configuration | LVs | | RMSECV /% | RPIQc | | RMSEP /% | RPIQv | Time /s |
|---|
| ASD_1/1 | 5/12 | 0.76/0.66 | 0.349/0.416 | 2.78/2.33 | 0.76/0.69 | 0.350/0.382 | 2.78/2.55 | >24 h/174.806 | | Con_3/10 | 5/12 | 0.77/0.66 | 0.339/0.415 | 2.87/2.35 | 0.76/0.69 | 0.332/0.381 | 2.94/2.56 | 553.184/138.728 | | Con_10/10 | 5/14 | 0.76/0.66 | 0.348/0.417 | 2.79/2.33 | 0.77/0.69 | 0.359/0.380 | 2.71/2.56 | 117.189/109.263 | | Con_20/20 | 5/14 | 0.74/0.67 | 0.357/0.410 | 2.72/2.37 | 0.77/0.68 | 0.325/0.392 | 3.00/2.48 | 15.941/55.348 | | Con_40/40 | 5/15 | 0.70/0.65 | 0.385/0.427 | 2.52/2.27 | 0.72/0.68 | 0.693/0.390 | 1.41/2.50 | 2.973/5.535 | | Con_60/60 | 5/12 | 0.63/0.64 | 0.431/0.427 | 2.26/2.28 | 0.6/0.64 | 0.464/0.417 | 2.11/2.34 | 1.353/2.222 | | Con_100/100 | 5/14 | 0.60/0.59 | 0.452/0.458 | 2.14/2.12 | 0.35/0.54 | 0.567/0.463 | 1.72/2.11 | 0.674/0.736 |
|
Table 4. Predicted results of SOM obtained by combining best spectral parameters/all-optical spectral parameters in different spectral configurations
| Configuration | LVs | | RMSECV / | RPIQc | | RMSEP / | RPIQv | Time /s |
|---|
| ASD_1/1 | 5/4 | 0.70/0.52 | 7.12/9.05 | 2.12/1.67 | 0.68/0.51 | 7.06/8.79 | 2.15/1.73 | >24 h/172.844 | | Con_3/10 | 5/4 | 0.71/0.51 | 7.27/9.42 | 2.14/1.65 | 0.70/0.51 | 7.04/9.17 | 2.15/1.65 | 554.677/128.822 | | Con_10/10 | 5/4 | 0.70/0.52 | 7.17/9.08 | 2.11/1.67 | 0.69/0.49 | 6.88/8.96 | 2.21/1.70 | 120.039/105.332 | | Con_20/20 | 5/4 | 0.72/0.52 | 6.94/9.09 | 2.18/1.66 | 0.69/0.49 | 6.92/8.95 | 2.19/1.70 | 15.864/57.023 | | Con_40/40 | 5/4 | 0.67/0.52 | 7.46/9.05 | 2.03/1.67 | 0.65/0.48 | 7.33/9.10 | 2.07/1.67 | 2.431/5.236 | | Con_60/60 | 5/4 | 0.67/0.52 | 7.74/9.32 | 2.02/1.68 | 0.66/0.49 | 7.87/8.96 | 1.93/1.70 | 1.062/2.169 | | Con_100/100 | 5/4 | 0.66/0.50 | 7.61/9.27 | 1.99/1.63 | 0.66/0.49 | 7.21/8.98 | 2.11/1.69 | 0.566/0.739 |
|
Table 5. Prediction results of EC obtained by combining best spectral parameters/all-optical spectral parameters in different spectral configurations