
Liu Feng, Guo Meng, Wang Xiangjun. Small Target Detection Based on Cross-Scale Fusion Convolution Neural Network[J]. Laser & Optoelectronics Progress, 2021, 58(6): 610012
- Laser & Optoelectronics Progress
- Vol. 58, Issue 6, 610012 (2021)
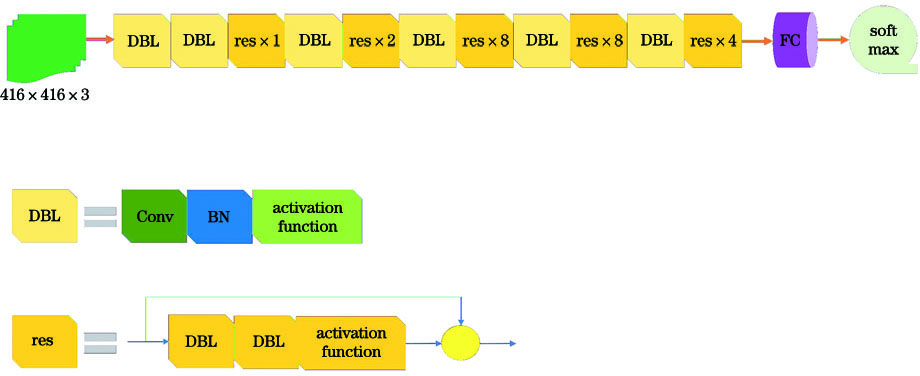
Fig. 1. Structure of the Darknet-53

Fig. 2. DOTA data set. (a) Original image; (b) cropped image
Fig. 3. Enhancement of the DOTA data set. (a) Original image; (b) enhanced image
Fig. 4. Improved network prediction structure1
Fig. 5. Improved network prediction structure2
Fig. 6. Optimized network of the receptive field
Fig. 7. Detection effect of different networks. (a) YOLOv3; (b) structure1; (c) structure2
Fig. 8. Loss curve during training
Fig. 9. Recognition effect of different networks. (a) Structure2; (b) optimize the network of the receptive field
Fig. 10. Detection results of different networks under the COCO data set. (a) YOLOv3 network; (b) optimize the network of the receptive field
|
Table 1. Performance of different backbone networks
|
Table 2. Recall rates of different networks unit: %
|
Table 3. Precision rates of different networks unit: %
|
Table 4. Multi-category recall rates of different networks unit: %
|
Table 5. Multi-class precision rates of different networks unit: %
|
Table 6. Basic parameters of different networks
|
Table 7. Recall rates of different networks under the COCO data set unit: %
|
Table 8. Precision rates of different networks under the COCO data set unit: %

Set citation alerts for the article
Please enter your email address
© Copyright 2018-2021 | Chinese Laser Press. All Rights Reserved 沪ICP备15018463号-20