• Spectroscopy and Spectral Analysis
  • Vol. 42, Issue 6, 1691 (2022)
Quan-lun LI1、*, Zheng-guang CHEN1、1; *;, and Xian-da SUN2、2;
Author Affiliations
  • 11. College of Information and Electrical Engineering, Heilongjiang Bayi Agricultural University, Daqing 163319, China
  • 22. Key Laboratory of Continental Shale Hydrocarbon Accumulation and Efficient Development, Ministry of Education, Northeast Petroleum University, Daqing 163318, China
  • show less
    DOI: 10.3964/j.issn.1000-0593(2022)06-1691-07 Cite this Article
    Quan-lun LI, Zheng-guang CHEN, Xian-da SUN. Rapid Detection of Total Organic Carbon in Oil Shale Based on Near Infrared Spectroscopy[J]. Spectroscopy and Spectral Analysis, 2022, 42(6): 1691 Copy Citation Text show less
    Original spectra
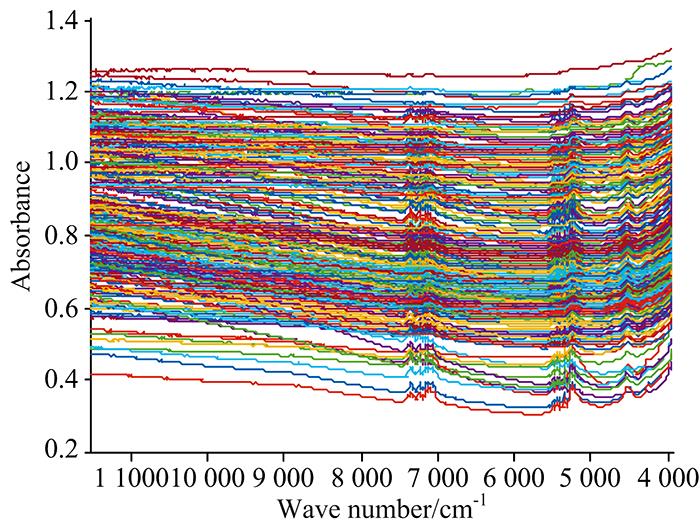
    Fig. 1. Original spectra
    Spectra after DT+BSC pretreatment
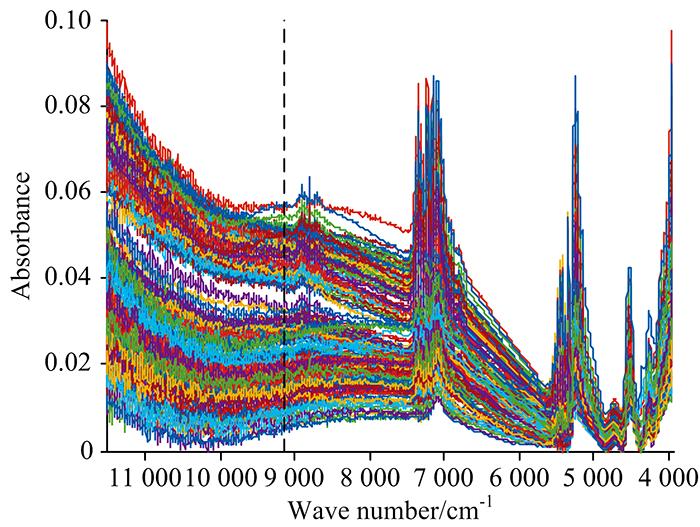
    Fig. 2. Spectra after DT+BSC pretreatment
    RMSE values of models with different characteristic wavelength numbers
    Fig. 3. RMSE values of models with different characteristic wavelength numbers
    Characteristic wavelengths selected based on SPA algorithm
    Fig. 4. Characteristic wavelengths selected based on SPA algorithm
    Stability index of each wavelength variable and random variable
    Fig. 5. Stability index of each wavelength variable and random variable
    Characteristic wavelengths selected based on UVE algorithm
    Fig. 6. Characteristic wavelengths selected based on UVE algorithm
    Process of selecting characteristic wavelengths based on CARS algorithm
    Fig. 7. Process of selecting characteristic wavelengths based on CARS algorithm
    Characteristic wavelengths selected based on CARS algorithm
    Fig. 8. Characteristic wavelengths selected based on CARS algorithm
    剔除方法样本个数Rc2RMSECVRv2RMSEP
    未剔除2300.660 80.419 00.624 60.443 6
    MCCV2160.718 90.366 30.688 40.386 3
    Table 1. Modeling results before and after removing outlier samples
    光谱预处理方法Rc2RMSECRv2RMSEV
    0.718 90.366 30.688 40.386 3
    DT0.746 00.341 40.621 60.382 0
    Derivative-10.706 70.303 80.643 60.310 6
    Derivative-20.719 80.365 80.663 90.342 3
    SNV0.548 70.464 20.376 00.426 5
    S-G0.729 30.359 60.695 30.382 4
    BSC0.658 50.403 80.570 80.449 4
    DT+SNV0.739 31.352 70.578 00.334 8
    DT+BSC0.759 10.315 90.734 80.357 3
    Table 2. Modeling results under different pretreatment methods
    样本类型样本数最小值/%最大值/%均值/%标准差
    总体样本2160.0533.9221.8350.693
    校正集1440.0533.9221.8970.747
    验证集720.6992.7831.7130.551
    Table 3. Sample set division
    建模
    方法
    特征波段
    筛选方法
    波段
    校正集验证集
    Rc2RMSECRv2RMSEV
    SVM全谱波段1 2650.867 80.260 50.793 00.286 8
    CARS650.912 40.204 60.906 60.222 0
    UVE2530.882 80.222 60.806 50.282 0
    SPA160.883 50.244 00.815 30.278 0
    RF全谱波段1 2650.785 90.274 60.717 40.342 7
    CARS650.812 50.297 60.765 90.316 9
    UVE2530.857 20.285 10.799 30.278 0
    SPA160.842 50.293 70.812 70.323 5
    PLS全谱波段1 2650.765 50.314 80.742 10.342 5
    CARS650.803 80.322 40.761 60.280 9
    UVE2530.834 50.284 30.754 10.310 0
    SPA160.774 80.316 20.762 70.320 6
    Table 4. Modeling results of PLS, RF and SVM
    Quan-lun LI, Zheng-guang CHEN, Xian-da SUN. Rapid Detection of Total Organic Carbon in Oil Shale Based on Near Infrared Spectroscopy[J]. Spectroscopy and Spectral Analysis, 2022, 42(6): 1691
    Download Citation