Author Affiliations
1Shanghai Institute of Technical Physics, Chinese Academy of Sciences, Shanghai 200083, China2Key Laboratory of Infrared Detection and Imaging Technology, Chinese Academy of Sciences, Shanghai 200083, China3School of Optoelectronic Science and Engineering, Soochow University, Suzhou 215000, Chinashow less
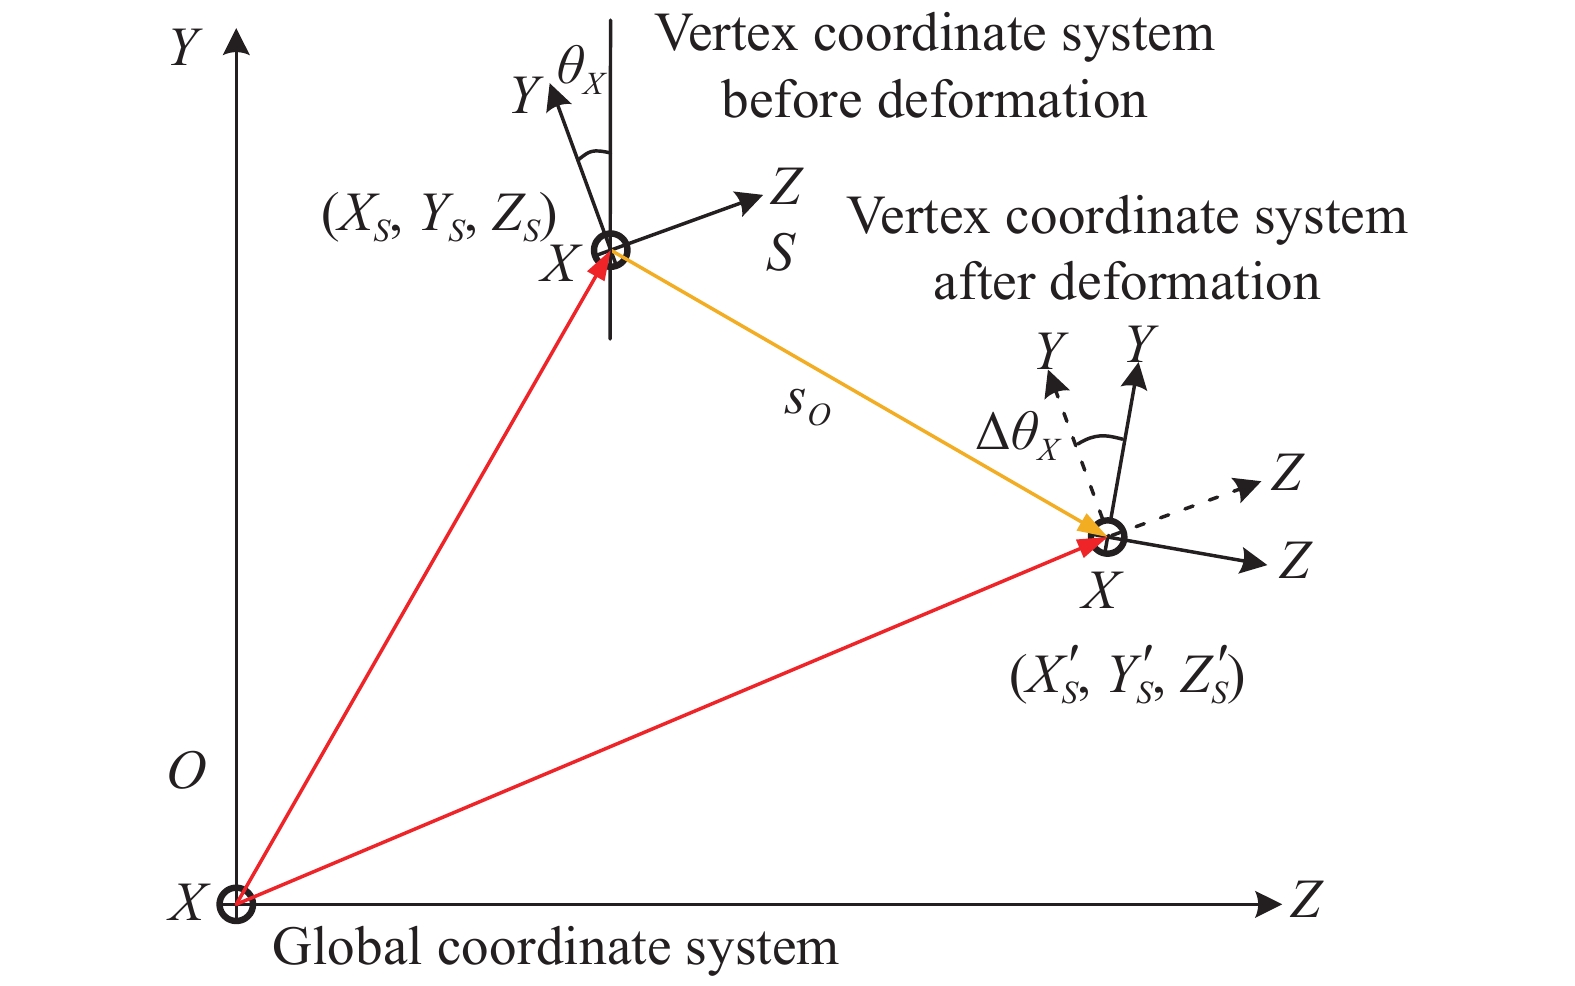
Fig. 1. Schematic diagram of optical surface vertex coordinate system
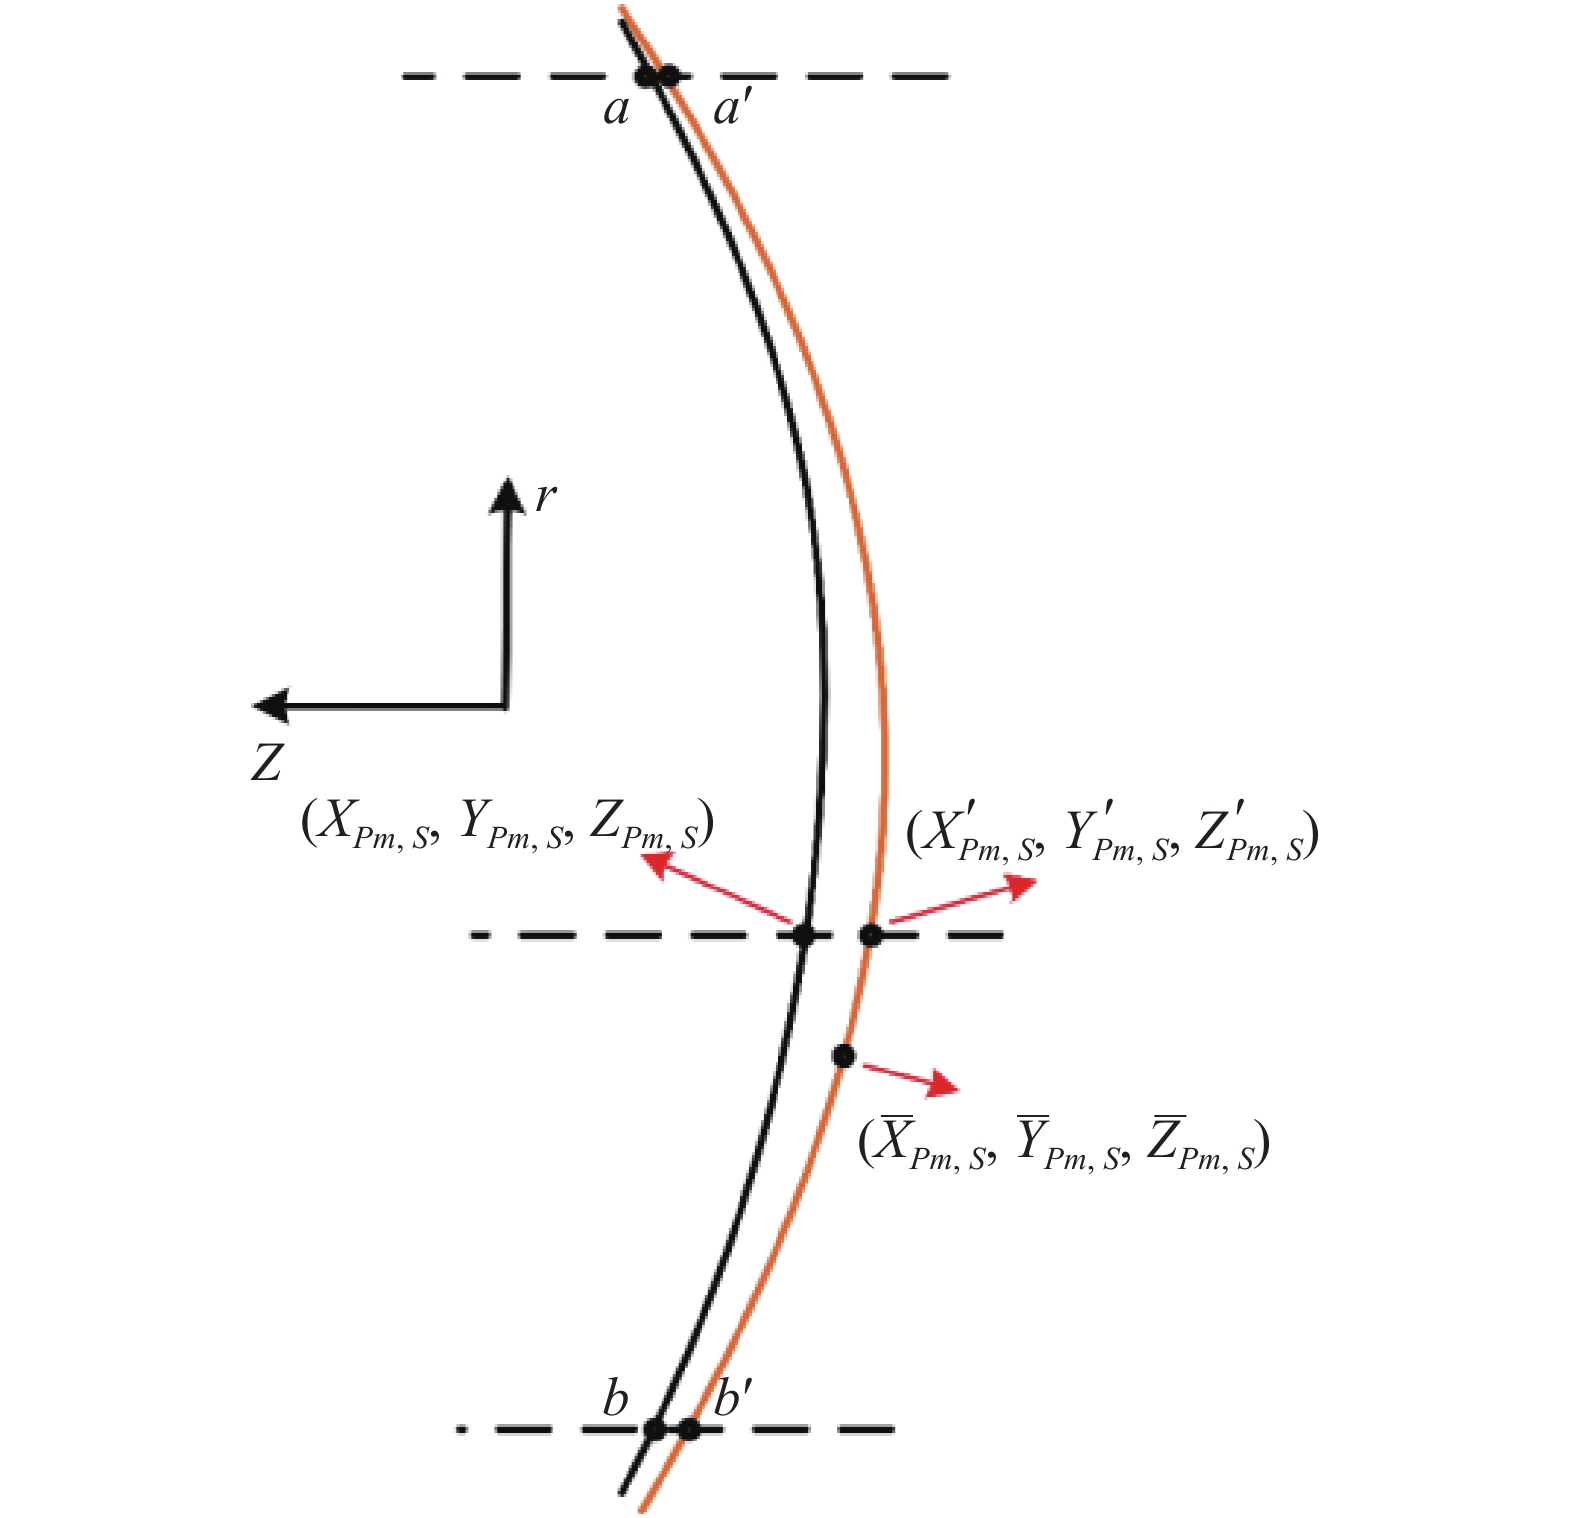
Fig. 2. Schematic diagram of light incident area before and after optical surface deformation
Fig. 3. Schematic diagram of light incident area before and after optical surface deformation
Fig. 4. Flow chart of the proposed optical surface deformation error calculation method
Fig. 5. Optical surface - Standard sphere (c=0.2, k=0.5)
Fig. 6. The fourth term of Fringe Zernike polynomial (Taking k4=1 as an example)
Fig. 7. Radial distribution of nodes on the optical surface. (a) 97 nodes;(b) 261 nodes;(c) 521 nodes;(d) 2191 nodes
Fig. 7. [in Chinese]
Fig. 8. Approximately uniform distribution of nodes on the optical surface. (a) 97 nodes;(b) 258 nodes;(c) 520 nodes;(d) 2193 nodes
Fig. 9. Relationship between estimation errors and number of nodes. (a) Rigid body motion;(b) Elastic deformation coefficient
Fig. 10. Approximately uniform distribution of nodes on the optical surface with X: (a) [−0.1, 0.1];(b) [−0.3, 0.3];(c) [−0.5, 0.5];(d) [−0.7, 0.7]
Fig. 10. [in Chinese]
Fig. 11. Relationship between estimation errors and the surface range coefficient. (a) Rigid body motion;(b) Elastic deformation
Fig. 12. An optical system with two mirrors. (a) Optical design; (b) Mechanical structure; (c) Finite element model
Fig. 13. Finite element and displacement of optical surfaces. (a) Finite element-primary mirror; (b) Displacement-primary mirror;(c) Finite element-secondary mirror; (d) Displacement-secondary mirror
Fig. 14. Elastic deformation and fitting residual. (a) Primary mirror deformation; (b) Deformation fitting residual of primary mirror;(c) Secondary mirror deformation; (d) Deformation fitting residual of secondary mirror
Fig. 15. Spot diagram and MTF curve. (a) Original spot diagram; (b) Original MTF;(c) Spot diagram of the deformed system; (d) MTF of the deformed system
| No. | Deformation error | Test value | Calculation of rigid body motion | | The proposed method | Traditional method | | 1 | Case I (Rigid body motion) | $ {T_x} $=1.0000 E-1
$ {T_y} $=1.0000 E-1
$ {T_z} $=1.0000 E-1
$ {\theta _x} $=0.0000
$ {\theta _y} $=0.0000
$ {\theta _z} $=0.0000
| $ {T_x} $=1.0000 E-1
$ {T_y} $=1.0000 E-1
$ {T_z} $=1.0000 E-1
$ {\theta _x} $=−1.6168 E-8
$ {\theta _y} $=−4.0098 E-9
$ {\theta _z} $=6.5839 E-9
| $ {T_x} $=1.0000 E-1
$ {T_y} $=1.0000 E-1
$ {T_z} $=8.5600 E-2
$ {\theta _x} $=−7.3240 E-10
$ {\theta _y} $=1.4389 E-4
$ {\theta _z} $=−2.6730 E-10
| | 2 | Case II (Rigid body motion) | $ {T_x} $=1.0000 E-3
$ {T_y} $=1.0000 E-3
$ {T_z} $=1.0000 E-3
$ {\theta _x} $=0.0000
$ {\theta _y} $=0.0000
$ {\theta _z} $=0.0000
| $ {T_x} $=1.0000 E-3
$ {T_y} $=1.0000 E-3
$ {T_z} $=9.9999 E-4
$ {\theta _x} $=1.3572 E-8
$ {\theta _y} $=−1.2696 E-8
$ {\theta _z} $=−1.8522 E-9
| $ {T_x} $=9.9994 E-4
$ {T_y} $=9.9999 E-4
$ {T_z} $=8.5637 E-4
$ {\theta _x} $=1.7830 E-9
$ {\theta _y} $=1.4343 E-6
$ {\theta _z} $=1.5747 E-10
| | 3 | Case III (Rigid body motion) | $ {T_x} $=1.0000 E-3
$ {T_y} $=1.0000 E-3
$ {T_z} $=1.0000 E-3
$ {\theta _x} $=1.0000 E-3
$ {\theta _y} $=1.0000 E-3
$ {\theta _z} $=1.0000 E-3
| $ {T_x} $=1.0000 E-3
$ {T_y} $=9.9999 E-4
$ {T_z} $=9.9999 E-4
$ {\theta _x} $=1.0000 E-3
$ {\theta _y} $=1.0000 E-3
$ {\theta _z} $=9.9999 E-4
| $ {T_x} $=9.9672 E-4
$ {T_y} $=1.0000 E-3
$ {T_z} $=8.4683 E-4
$ {\theta _x} $=1. 1101 E-3
$ {\theta _y} $=1.0977 E-3
$ {\theta _z} $=9.9953 E-4
| | 4 | Elastic deformation | $ {T_x} $=0.0000
$ {T_y} $=0.0000
$ {T_z} $=0.0000
$ {\theta _x} $=0.0000
$ {\theta _y} $=0.0000
$ {\theta _z} $=0.0000
k4=1.0000 E-3
| $ {T_x} $=4.9010 E-7
$ {T_y} $=8.7944 E-10
$ {T_z} $=3.2373 E-6
$ {\theta _x} $=−5.4085 E-10
$ {\theta _y} $=−1.4595 E-5
$ {\theta _z} $=−1.3092 E-9
| $ {T_x} $=4.9005 E-7
$ {T_y} $=8.8007 E-10
$ {T_z} $=3.2373 E-6
$ {\theta _x} $=−5.4015 E-10
$ {\theta _y} $=−1.4595 E-5
$ {\theta _z} $=−1.3093 E-10
| | 5 | Rigid body motion + elastic deformation | $ {T_x} $=1.0000 E-3
$ {T_y} $=1.0000 E-3
$ {T_z} $=1.0000 E-3
$ {\theta _x} $=1.0000 E-3
$ {\theta _y} $=1.0000 E-3
$ {\theta _z} $=1.0000 E-3
k4=1.0000 E-3
| $ {T_x} $=1.0004 E-3
$ {T_y} $=9.9999 E-4
$ {T_z} $=1.0032 E-3
$ {\theta _x} $=9.9994 E-4
$ {\theta _y} $=9.8545 E-4
$ {\theta _z} $=9.9997 E-4
| $ {T_x} $=9.9722 E-4
$ {T_y} $=1.0038 E-3
$ {T_z} $=8.5007 E-4
$ {\theta _x} $=1.1101 E-3
$ {\theta _y} $=1.0830 E-3
$ {\theta _z} $=9.9952 E-4
|
|
Table 1. Comparison of rigid body motion of the optical surface (Rmax=1, c=0.2, k=0.5)
| No. | Deformation error | Test value | Calculation of rigid body motion | | Proposed method | Traditional method | | 1 | Case I (Rigid body motion) | $ {T_x} $=1.0000 E-1
$ {T_y} $=1.0000 E-1
$ {T_z} $=1.0000 E-1
$ {\theta _x} $=0.0000
$ {\theta _y} $=0.0000
$ {\theta _z} $=0.0000
| $ {T_x} $=1.0000 E-1
$ {T_y} $=1.0000 E-1
$ {T_z} $=1.0000 E-1
$ {\theta _x} $=1.5220 E-10
$ {\theta _y} $=−1.8239 E-11
$ {\theta _z} $=1.1900 E-10
| $ {T_x} $=1.0000 E-1
$ {T_y} $=1.0000 E-1
$ {T_z} $=8.5600 E-2
$ {\theta _x} $=−5.4967 E-10
$ {\theta _y} $=1.4384 E-5
$ {\theta _z} $=−8.5772 E-11
| | 2 | Case II (Rigid body motion) | $ {T_x} $=1.0000 E-3
$ {T_y} $=1.0000 E-3
$ {T_z} $=1.0000 E-3
$ {\theta _x} $=0.0000
$ {\theta _y} $=0.0000
$ {\theta _z} $=0.0000
| $ {T_x} $=9.9999 E-4
$ {T_y} $=9.9999 E-4
$ {T_z} $=9.9999 E-4
$ {\theta _x} $=−9.4591 E-11
$ {\theta _y} $=−1.9287 E-11
$ {\theta _z} $=−4.8523 E-11
| $ {T_x} $=9.9995 E-4
$ {T_y} $=9.9999 E-4
$ {T_z} $=8.5637 E-4
$ {\theta _x} $=−3.1314 E-9
$ {\theta _y} $=1.3656 E-7
$ {\theta _z} $=−9.2801 E-11
| | 3 | Case III (Rigid body motion) | $ {T_x} $=1.0000 E-3
$ {T_y} $=1.0000 E-3
$ {T_z} $=1.0000 E-3
$ {\theta _x} $=1.0000 E-3
$ {\theta _y} $=1.0000 E-3
$ {\theta _z} $=1.0000 E-3
| $ {T_x} $=1.0000 E-3
$ {T_y} $=1.0000 E-3
$ {T_z} $=1.0000 E-3
$ {\theta _x} $=9.9999 E-4
$ {\theta _y} $=1.0000 E-3
$ {\theta _z} $=1.0000 E-3
| $ {T_x} $=9.9733 E-4
$ {T_y} $=1.0113 E-3
$ {T_z} $=3.0511 E-4
$ {\theta _x} $=1. 0325 E-3
$ {\theta _y} $=1.0087 E-3
$ {\theta _z} $=9.9951 E-4
|
|
Table 2. Comparison of rigid body motion of the optical surface (Rmax=10, c=0.02, k=0.5)
| No. | Deformation error | Test value | Calculation of rigid body motion | | Proposed method | Traditional method | | 1 | Case I (Rigid body motion) | $ {T_x} $=1.0000 E-1
$ {T_y} $=1.0000 E-1
$ {T_z} $=1.0000 E-1
$ {\theta _x} $=0.0000
$ {\theta _y} $=0.0000
$ {\theta _z} $=0.0000
| $ {T_x} $=1.0000 E-1
$ {T_y} $=1.0000 E-1
$ {T_z} $=1.0000 E-1
$ {\theta _x} $=−7.8975 E-12
$ {\theta _y} $=1.1882 E-11
$ {\theta _z} $=−4.5312 E-12
| $ {T_x} $=1.0000 E-1
$ {T_y} $=1.0000 E-1
$ {T_z} $=8.5600 E-2
$ {\theta _x} $=−4.1705 E-10
$ {\theta _y} $=−1.4335 E-6
$ {\theta _z} $=2.0338 E-10
| | 2 | Case II (Rigid body motion) | $ {T_x} $=1.0000 E-3
$ {T_y} $=1.0000 E-3
$ {T_z} $=1.0000 E-3
$ {\theta _x} $=0.0000
$ {\theta _y} $=0.0000
$ {\theta _z} $=0.0000
| $ {T_x} $=1.0000 E-3
$ {T_y} $=1.0000 E-3
$ {T_z} $=9.9999 E-4
$ {\theta _x} $=−3.3836 E-11
$ {\theta _y} $=−1.5327 E-12
$ {\theta _z} $=−1.5605 E-11
| $ {T_x} $=9.9995 E-4
$ {T_y} $=9.9999 E-4
$ {T_z} $=8.5636 E-4
$ {\theta _x} $=3.3035 E-10
$ {\theta _y} $=1.0407 E-8
$ {\theta _z} $=−3.1869 E-10
| | 3 | Case III (Rigid body motion) | $ {T_x} $=1.0000 E-3
$ {T_y} $=1.0000 E-3
$ {T_z} $=1.0000 E-3
$ {\theta _x} $=1.0000 E-3
$ {\theta _y} $=1.0000 E-3
$ {\theta _z} $=1.0000 E-3
| $ {T_x} $=9.9987 E-4
$ {T_y} $=1.0000 E-3
$ {T_z} $=9.9973 E-4
$ {\theta _x} $=1.0000 E-3
$ {\theta _y} $=9.9999 E-4
$ {\theta _z} $=9.9999 E-4
| $ {T_x} $=1.0000 E-3
$ {T_y} $=1.0525 E-3
$ {T_z} $=−5.8487 E-3
$ {\theta _x} $=1. 0144 E-3
$ {\theta _y} $=9.9060 E-4
$ {\theta _z} $=9.9950 E-4
|
|
Table 3. Comparison of rigid body motion of the optical surface (Rmax=100, c=0.002, k=0.5)
| Statistical indicators | Method | $ {T_x} $![]() ![]() | $ {T_y} $![]() ![]() | $ {T_z} $![]() ![]() | $ {\theta _x} $![]() ![]() | $ {\theta _y} $![]() ![]() | $ {\theta _z} $![]() ![]() | | R2 | Proposed method | 1.0000 | 1.0000 | 1.0000 | 1.0000 | 1.0000 | 1.0000 | | Traditional method | 0.9998 | 0.9998 | 0.9118 | 0.9683 | 0.9658 | 1.0000 | | RRMSE | Proposed method | 2.0356 E-6 | 2.1224 E-6 | 1.9619 E-6 | 3.2531 E-6 | 2.4301 E-6 | 2.5259 E-6 | | Traditional method | 0.0148 | 0.0127 | 0.2959 | 0.1775 | 0.1842 | 0.0064 | | RMAE | Proposed method | 3.0167 E-6 | 3.1373 E-6 | 2.082 E-6 | 7.7869 E-6 | 6.2185 E-6 | 5.4196 E-6 | | Traditional method | 0.0453 | 0.0341 | 0.4880 | 0.4503 | 0.4255 | 0.0164 |
|
Table 4. Statistical error analysis for comparison between the proposed method and the traditional method
| Statistical index | Method | $ {T_x} $![]() ![]() | $ {T_y} $![]() ![]() | $ {T_z} $![]() ![]() | $ {\theta _x} $![]() ![]() | $ {\theta _y} $![]() ![]() | $ {\theta _z} $![]() ![]() | | R2 | Complete equation | 1.0000 | 1.0000 | 1.0000 | 1.0000 | 1.0000 | 1.0000 | | Simplified equation | 0.9999 | 0.9999 | 1.0000 | 1.0000 | 1.0000 | 1.0000 | | RRMSE | Complete equation | 1.9457 E-6 | 1.9696 E-6 | 1.91146 E-6 | 3.1742 E-6 | 2.3667 E-6 | 2.9295 E-6 | | Simplified equation | 0.0121 | 0.0114 | 1.6050 E-5 | 0.0024 | 0.0024 | 0.0053 | | RMAE | Complete equation | 31019 E-6 | 3.1034 E-6 | 2.7365 E-6 | 8.1965 E-6 | 7.8133 E-6 | 6.6832 E-6 | | Simplified equation | 0.0328 | 0.0301 | 6.0652 E-5 | 0.0064 | 0.0066 | 0.0149 |
|
Table 5. Statistical error analysis for comparison between complete and simplified equations of rigid body motion
| Number of nodes | $ {T_x} $![]() ![]() | $ {T_y} $![]() ![]() | $ {T_z} $![]() ![]() | $ {\theta _x} $![]() ![]() | $ {\theta _y} $![]() ![]() | $ {\theta _z} $![]() ![]() | $ {k_{{\text{37}}}} $![]() ![]() | Surface error ratio | | 97 | 1.0007 E-3 | 1.9997 E-3 | 3.3057 E-3 | 9.9999 E-4 | 1.9969 E-3 | 3.0000 E-3 | 1.0000 E-3 | 3.7642 E-7 | | 261 | 1.0002 E-3 | 1.9998 E-3 | 3.1775 E-3 | 9.9999 E-4 | 2.0049 E-3 | 3.0000 E-3 | 1.0000 E-3 | 7.9573 E-7 | | 521 | 1.0002 E-3 | 1.9998 E-3 | 3.1774 E-3 | 9.9999 E-4 | 2.0026 E-3 | 3.0000 E-3 | 1.0000 E-3 | 3.9583 E-7 | | 1093 | 1.0001 E-3 | 1.9999 E-3 | 3.1334 E-3 | 9.9999 E-4 | 2.0032 E-3 | 3.0000 E-3 | 1.0000 E-3 | 7.6929 E-7 | | 2191 | 1.0001 E-3 | 1.9999 E-3 | 3.1141 E-3 | 9.9999 E-4 | 2.0026 E-3 | 3.0000 E-3 | 1.0000 E-3 | 8.6559 E-7 |
|
Table 6. Results for the case of radial distribution of nodes on the optical surface
| Number of nodes | $ {T_x} $![]() ![]() | $ {T_y} $![]() ![]() | $ {T_z} $![]() ![]() | $ {\theta _x} $![]() ![]() | $ {\theta _y} $![]() ![]() | $ {\theta _z} $![]() ![]() | $ {k_{{\text{37}}}} $![]() ![]() | Surface error ratio | | 97 | 1.0005 E-3 | 1.9997 E-3 | 3.2749 E-9 | 9.9999 E-4 | 2.0000 E-3 | 3.0000 E-3 | 1.0000 E-3 | 1.9526 E-8 | | 258 | 1.0004 E-3 | 1.9998 E-3 | 3.1834 E-3 | 9.9944 E-4 | 2.0000 E-3 | 3.0000 E-3 | 1.0000 E-3 | 1.3288 E-7 | | 520 | 1.0003 E-3 | 1.9998 E-3 | 3.1303 E-3 | 9.9916 E-4 | 2.0000 E-3 | 3.0000 E-3 | 1.0000 E-3 | 2.0133 E-7 | | 1092 | 1.0001 E-3 | 1.9999 E-3 | 3.0751 E-3 | 9.9877 E-4 | 2.0006 E-3 | 3.0000 E-3 | 1.0000 E-3 | 3.2122 E-7 | | 2193 | 1.0000 E-3 | 1.9999 E-3 | 3.0476 E-3 | 9.9937 E-4 | 1.9999 E-3 | 3.0000 E-3 | 1.0000 E-3 | 2.1161 E-7 |
|
Table 7. Results for the case of approximately uniform distribution of nodes on the optical surface
| Normalized
radius
| $ {T_x} $![]() ![]() /
mm /
mm
| $ {T_y} $![]() ![]() /
mm /
mm
| $ {T_z} $![]() ![]() /
mm /
mm
| $ {\theta _x} $![]() ![]() /
(°) /
(°)
| $ {\theta _y} $![]() ![]() /
(°) /
(°)
| $ {\theta _z} $![]() ![]() /
(°) /
(°)
| PV/
mm
| Surface
error ratio
| | Primary mirror | 48.7284 | −1.5587 E-5 | 3.3805 E-3 | −3.8495 E-3 | −6.1539 E-5 | 7.0932 E-8 | 2.3137 E-7 | 3.4480 E-6 | 0.44% | | Secondary mirror | 74.5760 | −5.0592 E-5 | 6.9241 E-3 | 9.2077 E-3 | 1.4575 E-4 | −4.1180 E-8 | 7.9050 E-7 | 1.9449 E-5 | 1.82% |
|
Table 8. Calculated deformation errors of primary mirror and secondary mirror