• Acta Optica Sinica
  • Vol. 41, Issue 17, 1733001 (2021)
Heng Zhang1, Weidong Qiao1、*, Jiaming Wang1, and Yi Li2
Author Affiliations
  • 1School of Mechanical and Precision Instrument Engineering, Xi′an University of Technology, Xi′an, Shaanxi 710048, China
  • 2Optical Metrology and Test Center, Shaanxi Institute of Metrology Science, Xi′an, Shaanxi 710100, China
  • show less
    DOI: 10.3788/AOS202141.1733001 Cite this Article Set citation alerts
    Heng Zhang, Weidong Qiao, Jiaming Wang, Yi Li. Analysis of Influence of Change in Field of View on Dynamic Glare Evaluation[J]. Acta Optica Sinica, 2021, 41(17): 1733001 Copy Citation Text show less
    Relationship between vehicle speed, field of view, and attention
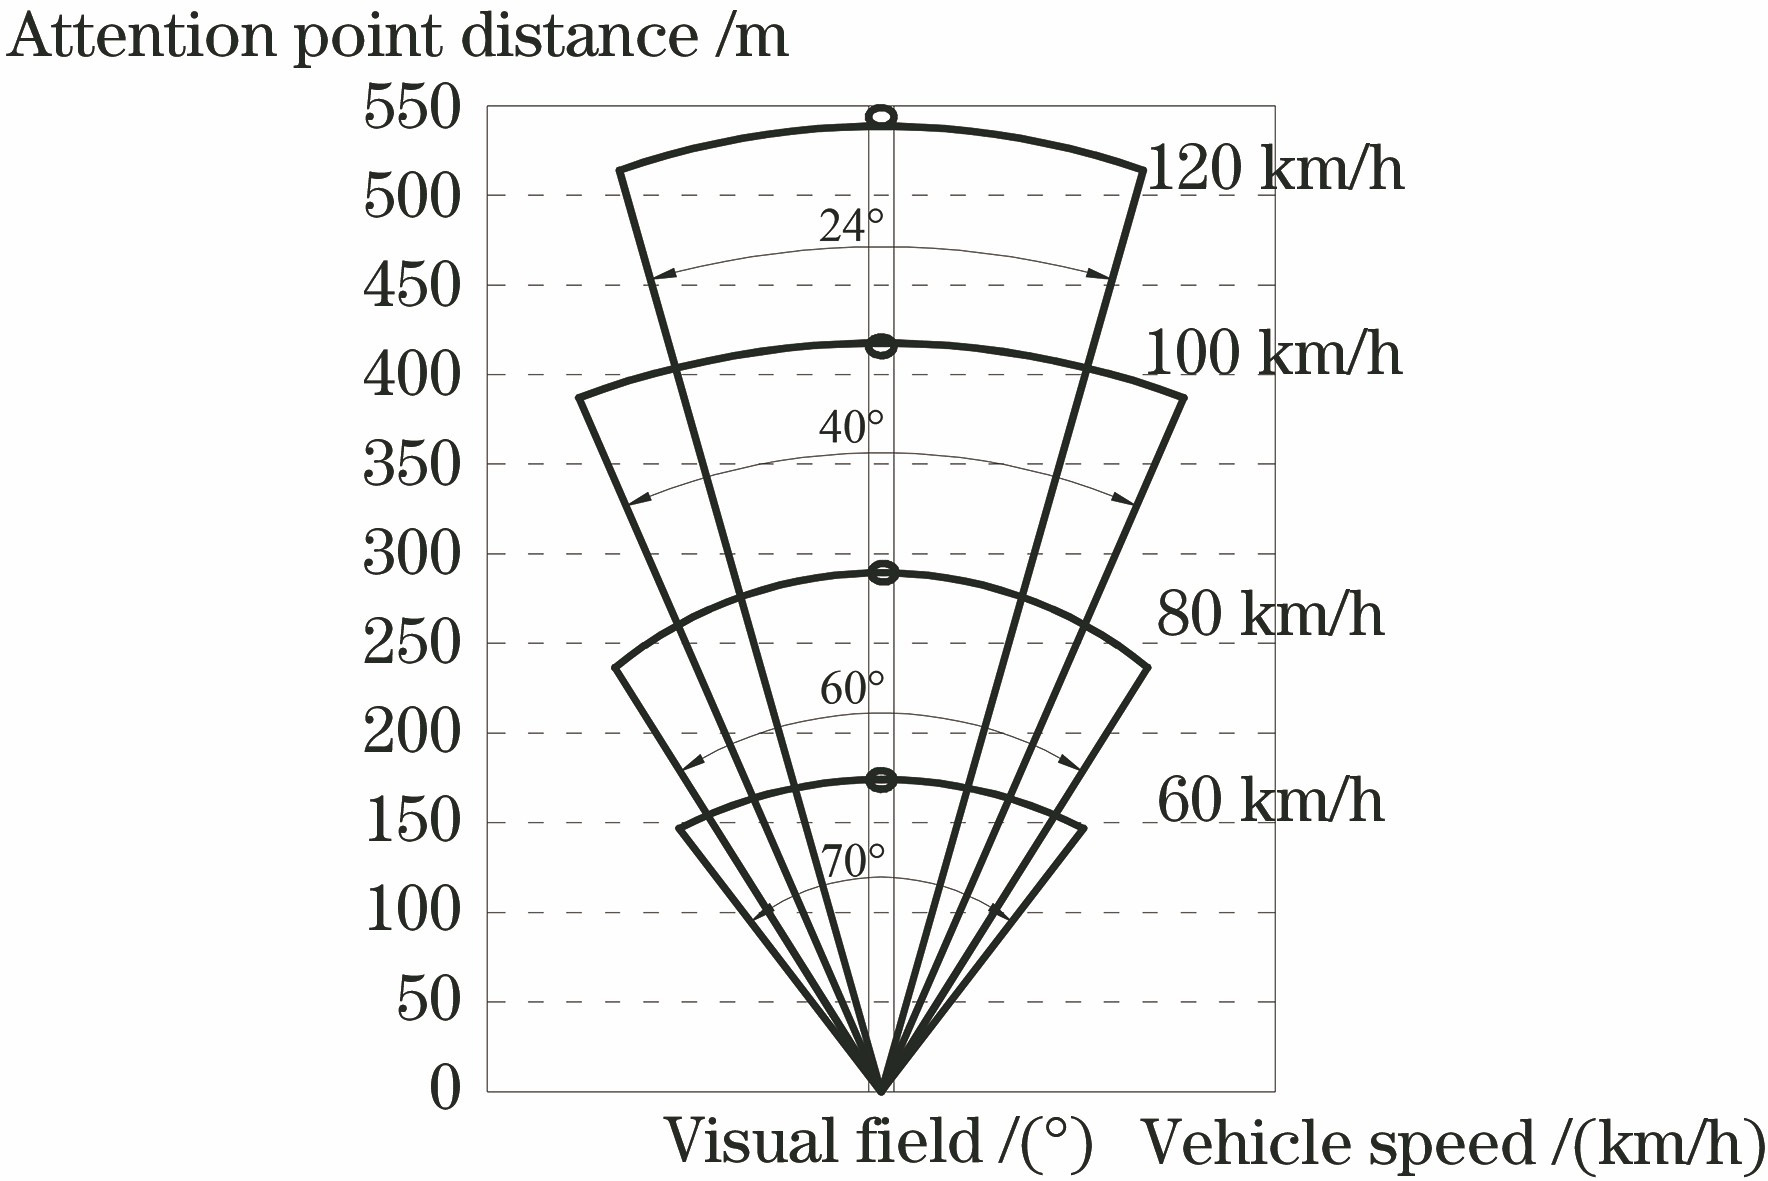
    Fig. 1. Relationship between vehicle speed, field of view, and attention
    Block diagram of technical route of dynamic glare evaluation model
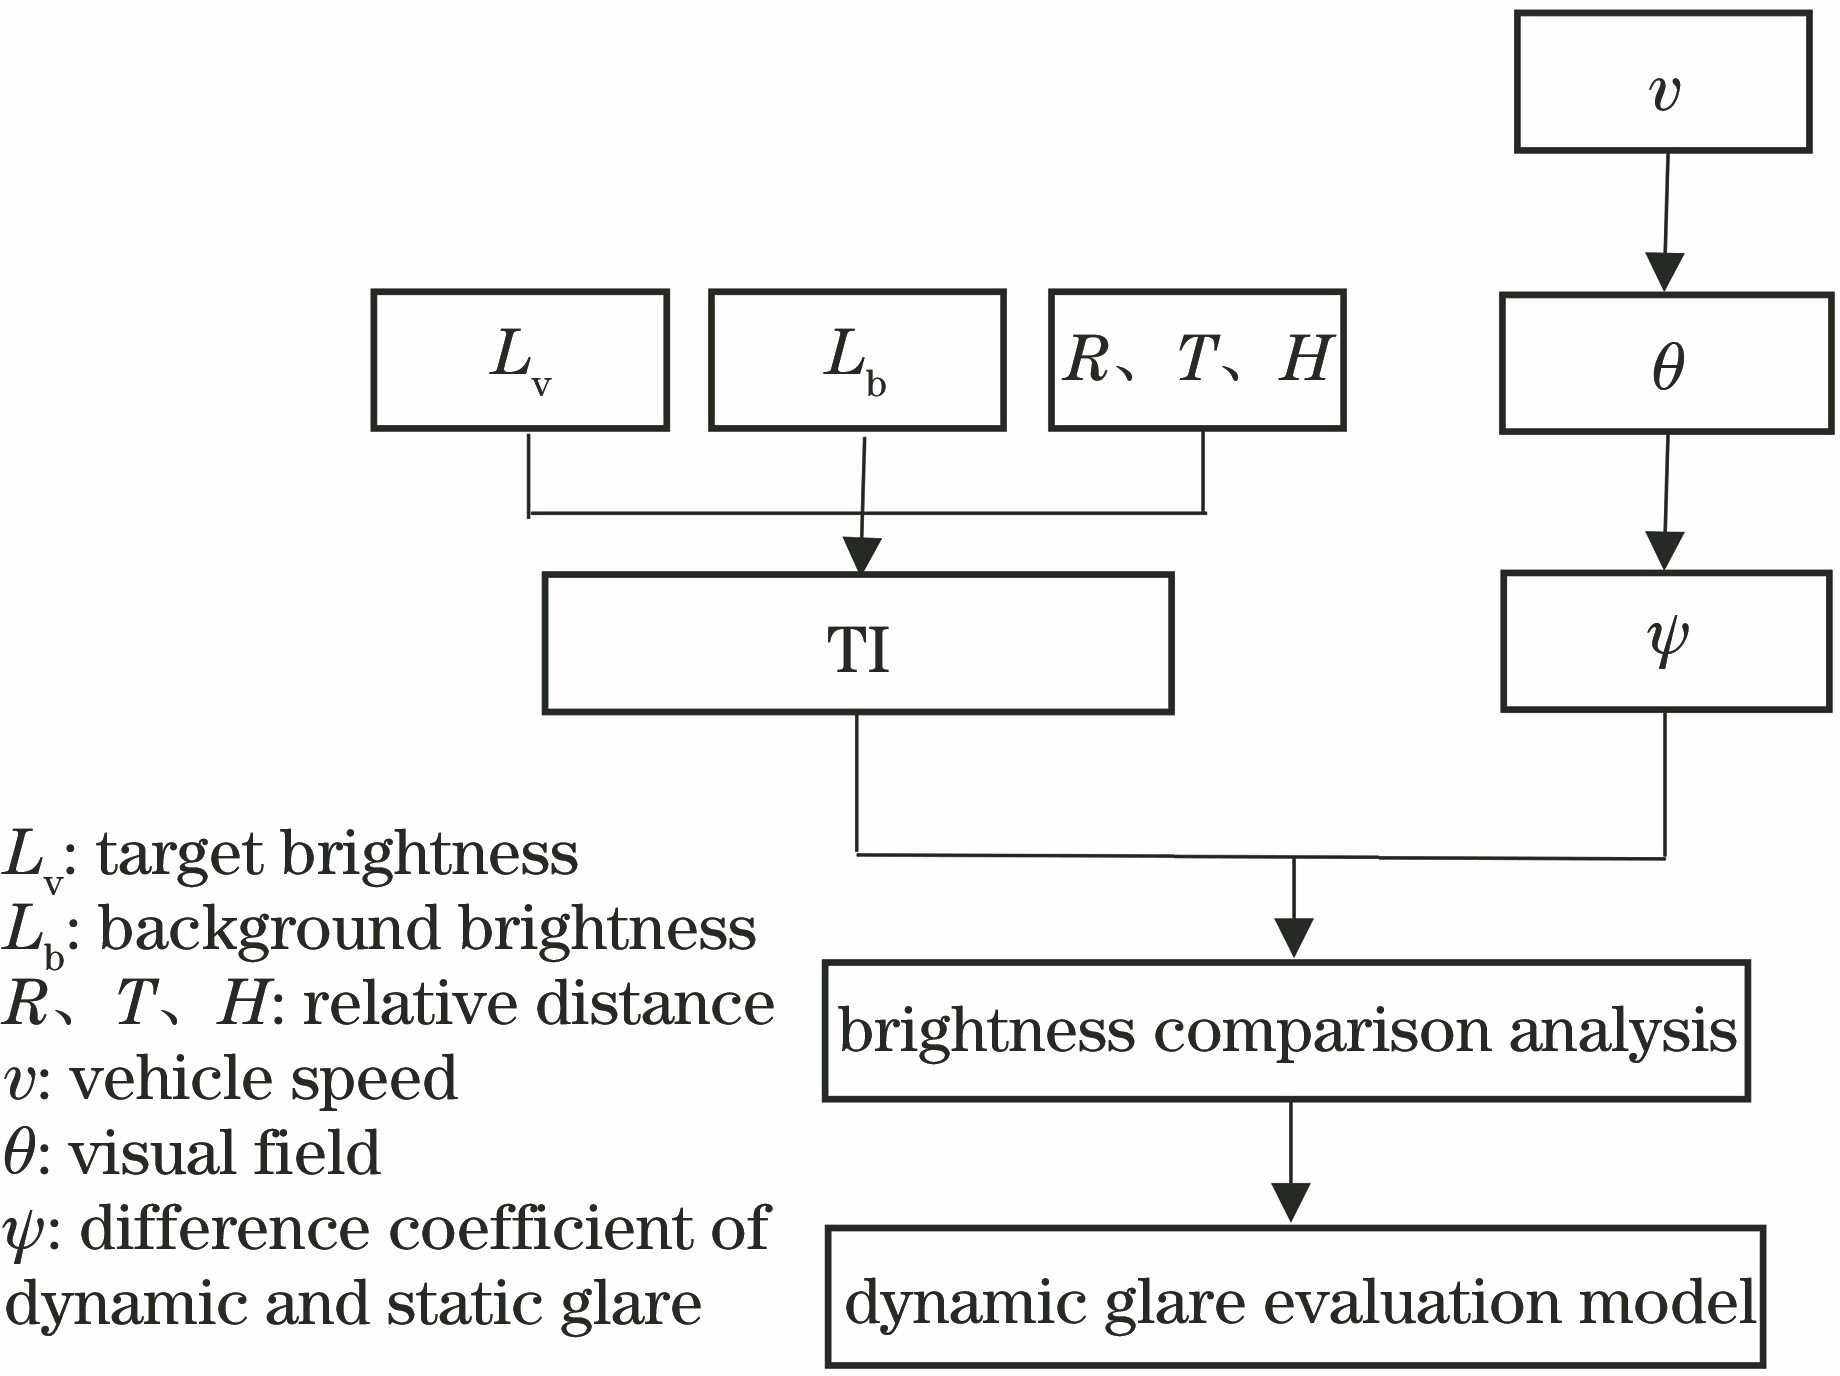
    Fig. 2. Block diagram of technical route of dynamic glare evaluation model
    A screenshot of road lighting environment of some road sections at different driving speeds. (a) 40 km/h; (b) 89 km/h
    Fig. 3. A screenshot of road lighting environment of some road sections at different driving speeds. (a) 40 km/h; (b) 89 km/h
    Dynamic and static brightness ratio of different road sections (80 km/h)
    Fig. 4. Dynamic and static brightness ratio of different road sections (80 km/h)
    Five kinds of function model fitting graphs. (a) Logarithmic type; (b) power function type; (c) inverse function type; (d) S-curve type; (e) exponential type
    Fig. 5. Five kinds of function model fitting graphs. (a) Logarithmic type; (b) power function type; (c) inverse function type; (d) S-curve type; (e) exponential type
    No. 1No. 2No. 3No. 4No. 2No. 6No. 7No. 8No. 9No. 10
    47878497623987351513483314826343755385024926156252
    48190504673911251577491334842544012388774945955752
    48188504443864951066496684777843823389384953655711
    47967504523779351182498924709644099388195011555505
    48022507213789751071497094572444170389774963155376
    50137512203775250089504154340444112415134989755366
    50497516693767950439503104365744420545194990055263
    50564518483789450234505754321844405538874942355603
    (Note: all the brightness data in Table 1 are replaced by the gray value of the intercepted picture, no unit)
    Table 1. Part of equivalent light curtain brightness data collected under static conditions on 10 experimental road sections
    No. 1No. 2No. 3No. 4No. 2No. 6No. 7No. 8No. 9No. 10
    47977526444498951713591695200752608476405438464183
    48291526994450651581598165243753079480595413963475
    48696520394445150895599685204352923482575375863642
    49065515814388450883593985189653247486165376564010
    48825512024412850685588145147253564493595313363540
    50421511454464549827582085019553334507595325863832
    50786512754456650397573325024653780609095295863830
    50579510744491950509569485015453609607225235164009
    (Note: all the brightness data in Table 2 are replaced by the gray value of the intercepted picture, no unit)
    Table 2. Part of the equivalent light curtain brightness data collected at 80 km/h on 10 experimental road sections
    Vehicle speed /(km·h-1)30405060708090100110120
    Average ratio1.001.021.031.041.071.101.131.141.151.16
    Table 3. Table of average ratio of dynamic and static equivalent light curtain brightness at different driving speeds on 10 experimental road sections
    EquationGoodness offit R2Varianceanalysis F
    Logarithmic type0.94124.18
    Power function type0.95137.58
    Inverse function type0.8338.54
    S-curve type0.8441.64
    Exponential type0.97298.76
    Table 4. Comparison table of fitting results of five functional models
    Heng Zhang, Weidong Qiao, Jiaming Wang, Yi Li. Analysis of Influence of Change in Field of View on Dynamic Glare Evaluation[J]. Acta Optica Sinica, 2021, 41(17): 1733001
    Download Citation