
Jiangping Zhu, Ruike Wang, Zhijuan Duan, Yijie Huang, Guohuan He, Pei Zhou. Three-Dimensional Face Modeling Based on Multi-Scale Attention Phase Unwrapping[J]. Acta Optica Sinica, 2022, 42(1): 0112005
- Acta Optica Sinica
- Vol. 42, Issue 1, 0112005 (2022)
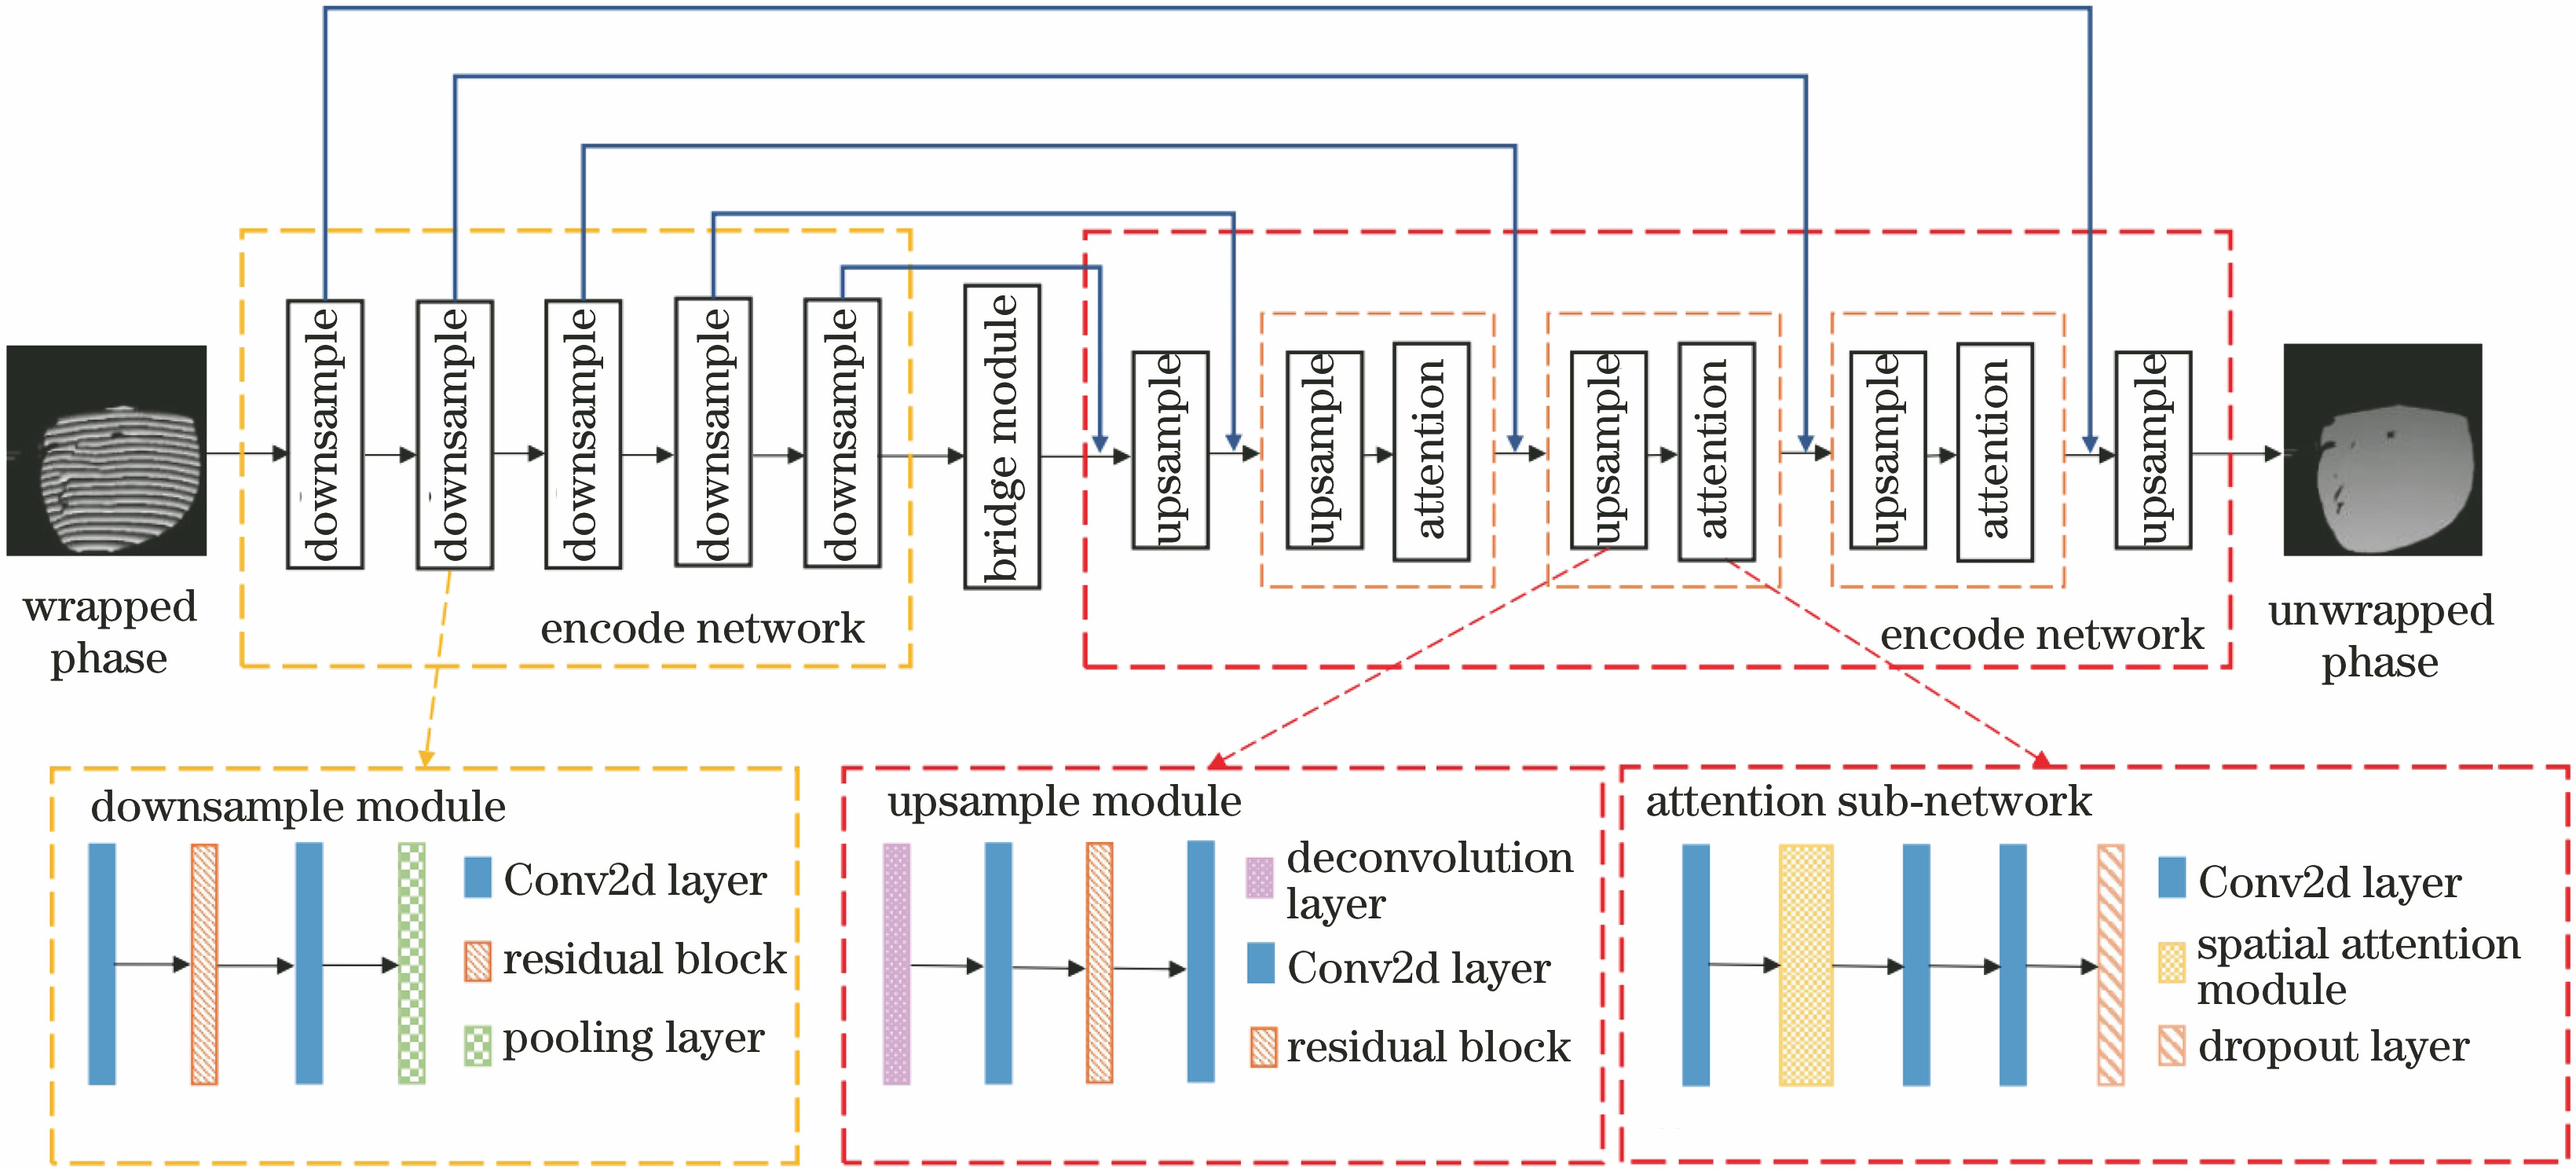
Fig. 1. Network architecture of MSAPUNet
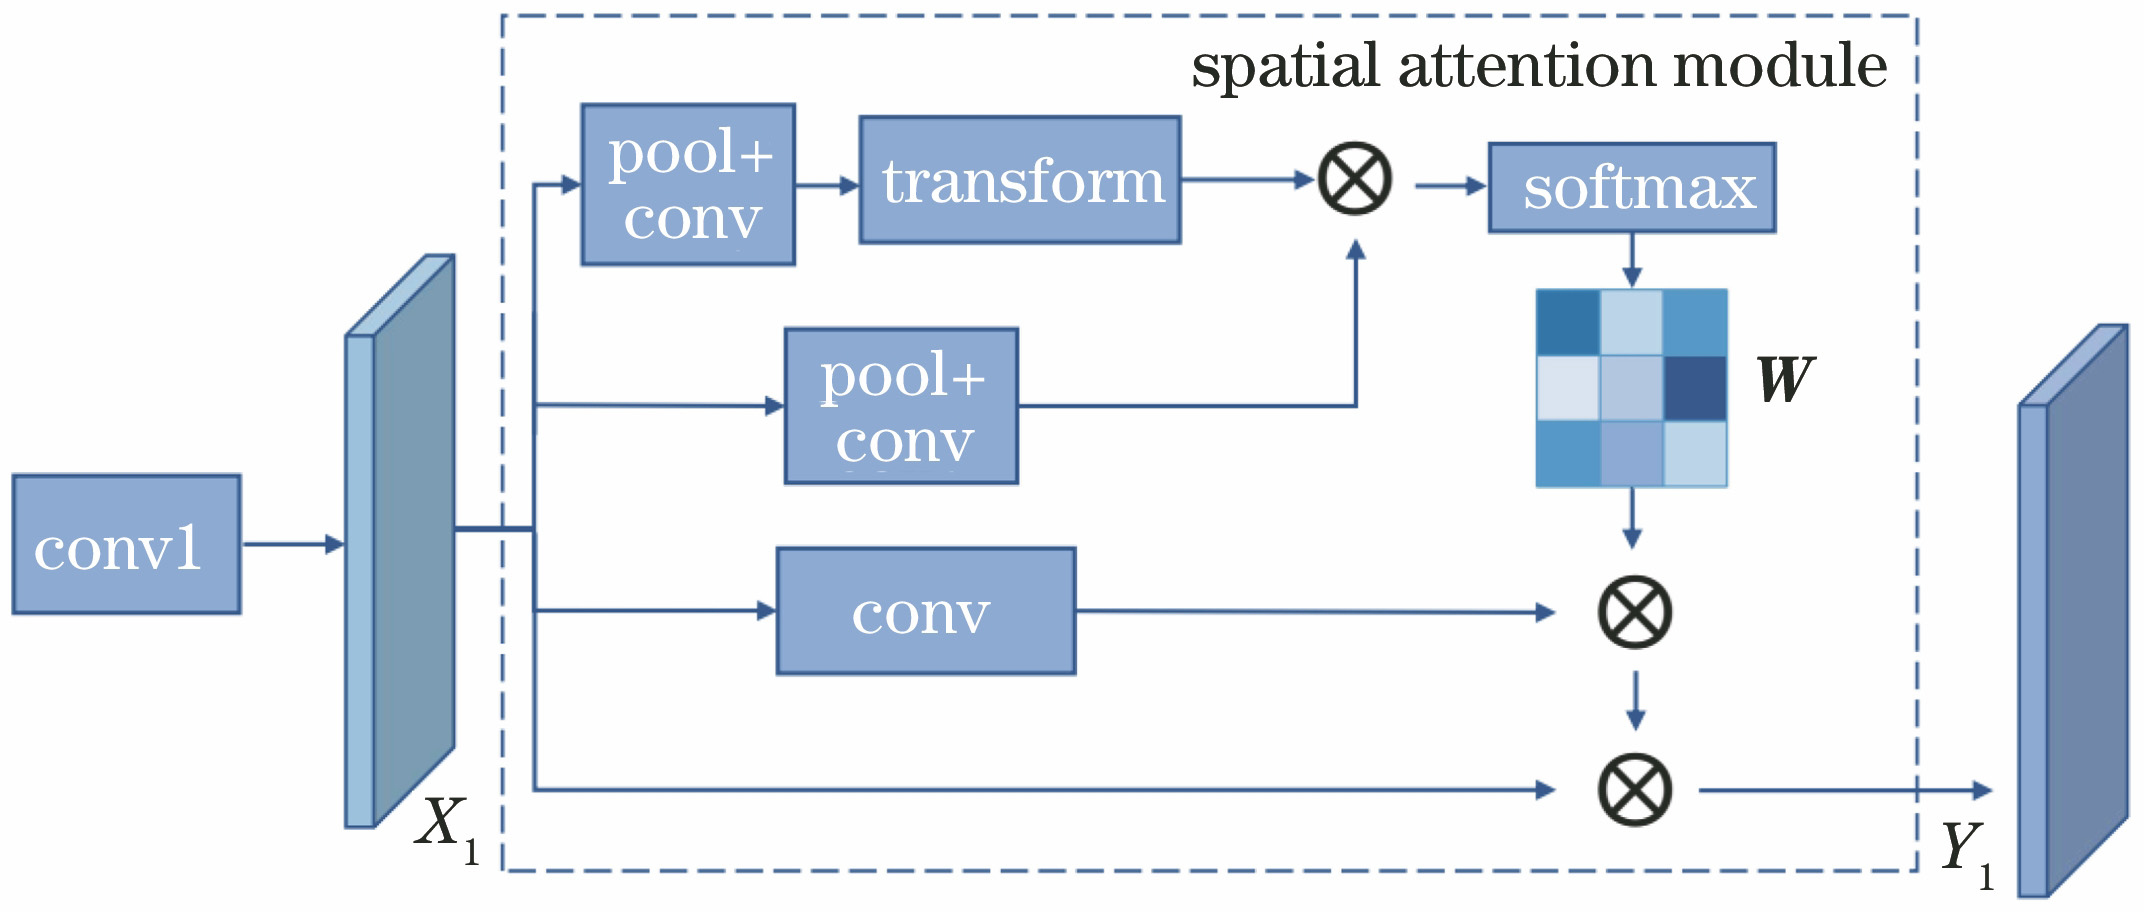
Fig. 2. Calculation process in spatial attention module
Fig. 3. Loss function curve
Fig. 4. Acquisition system
Fig. 5. Schematic diagram of dataset construction. (a) FACE dataset; (b) MASK dataset
Fig. 6. Phase map, point cloud model and error of point cloud model obtained by different methods in undersampling experiment. (a)--(e) Phase map; (f)--(j) point cloud model; (k)--(n) error of point cloud model
Fig. 7. Error maps obtained by different methods in undersampling experiment. (a) MSAPUNet; (b) U-Net; (c) QG algorithm; (d) BC algorithm
Fig. 8. Phase maps, point cloud models and errors of point cloud model obtained by different methods in phase discontinuity experiment. (a)--(e) Phase map; (f)--(j) point cloud model; (k)--(n) error of point cloud model
Fig. 9. Error maps obtained by different methods in phase discontinuity experiment. (a) MSAPUNet; (b) U-Net; (c) QG algorithm; (d) BC algorithm
Fig. 10. Experimental results of dynamic target. (a) Texture map; (b) wrapped phase; (c) phase generated by TPU algorithm; (d) phase generated by U-Net; (e) phase generated by MSAPUNet
Fig. 11. The 60th column phase in dynamic target experiment
| |||||||||||||||||||||||||||||||||||
Table 1. RMSE and SSIM of different algorithms in FACE dataset and MASK dataset
|
Table 2. Efficiency of different methods
|
Table 3. RMSE and SSIM of different methods in undersampling experiment
|
Table 4. Errors of point cloud model obtained by different methods in undersampling experimentunit: mm
|
Table 5. RMSE and SSIM of different methods in phase discontinuity experiment
|
Table 6. Errors of point cloud model obtained by different methods in undersampling experimentunit: mm

Set citation alerts for the article
Please enter your email address
© Copyright 2018-2021 | Chinese Laser Press. All Rights Reserved 沪ICP备15018463号-20