• Laser & Optoelectronics Progress
  • Vol. 60, Issue 7, 0714007 (2023)
Rui Di, Kaihua Wei*, Lingyun Xue, Lei Zhu, and Qingguang Chen
Author Affiliations
  • School of Automation, Hangzhou Dianzi University, Hangzhou 310018, Zhejiang, China
  • show less
    DOI: 10.3788/LOP213177 Cite this Article Set citation alerts
    Rui Di, Kaihua Wei, Lingyun Xue, Lei Zhu, Qingguang Chen. Numerical Investigation of All-Normal Dispersion Mode-Locked PbSe Quantum Dot Fiber Laser[J]. Laser & Optoelectronics Progress, 2023, 60(7): 0714007 Copy Citation Text show less
    Structure of ANDi dissipative soliton mode-locking fiber laser with a PbSe QDF as gain medium
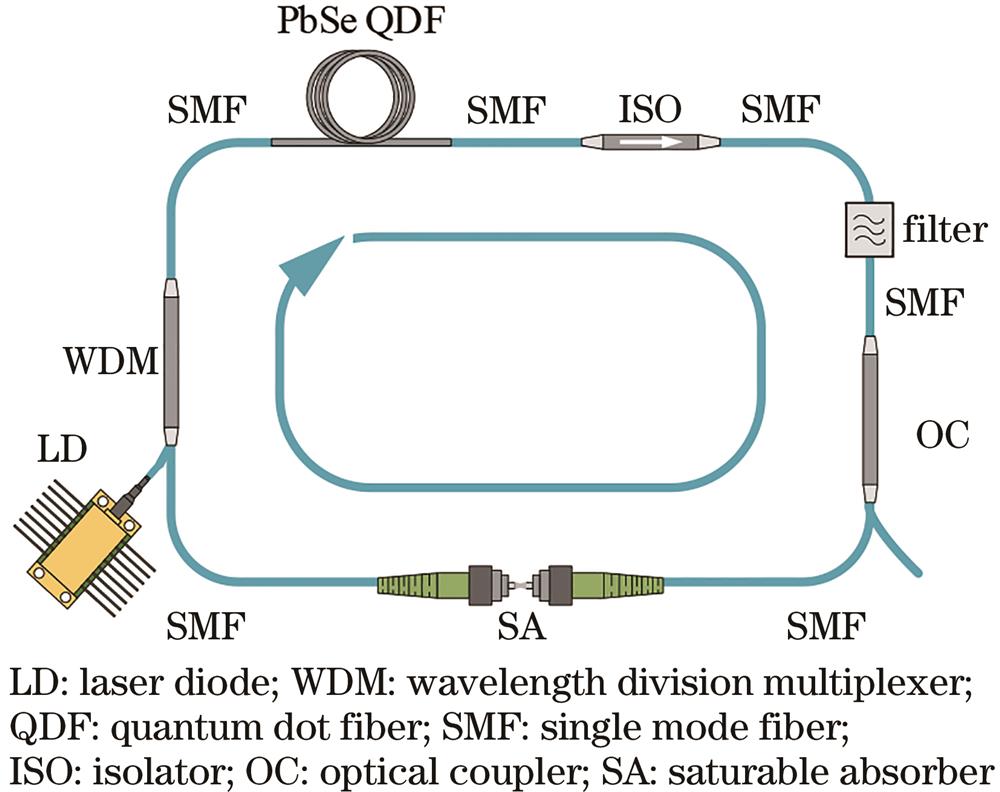
    Fig. 1. Structure of ANDi dissipative soliton mode-locking fiber laser with a PbSe QDF as gain medium
    Buildup dynamics of dissipative soliton. Evolution of output (a) pulses and (d) spectra during 2000 roundtrips; evolution of output (b) pulses and (e) spectra during 150 roundtrips, marked with black curves per 15 roundtrips; 2D figures of output (c) pulses and (f) spectra after per 15 roundtrips within 150 roundtrips
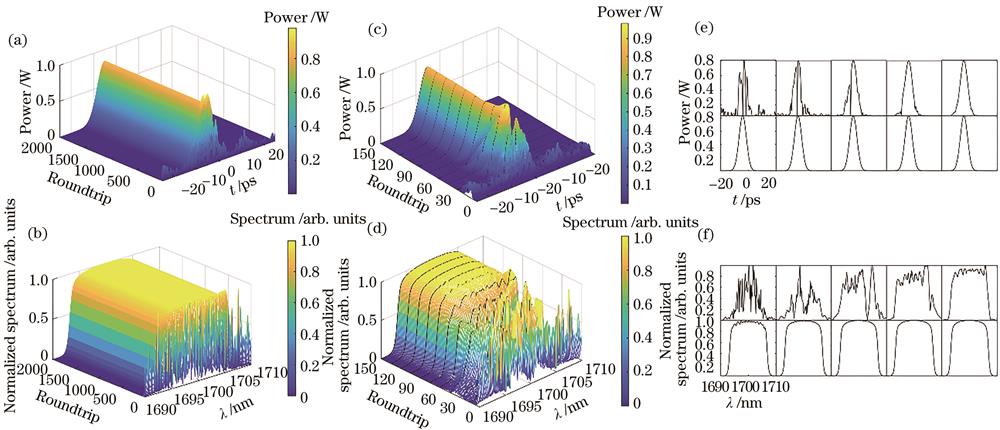
    Fig. 2. Buildup dynamics of dissipative soliton. Evolution of output (a) pulses and (d) spectra during 2000 roundtrips; evolution of output (b) pulses and (e) spectra during 150 roundtrips, marked with black curves per 15 roundtrips; 2D figures of output (c) pulses and (f) spectra after per 15 roundtrips within 150 roundtrips
    Evolution of steady dissipative soliton in cavity. (a) Pulses and (b) spectra in each position of cavity; (c) pulses and (d) spectra after passing through each device in cavity, insert graph is enlarged details; (e) change of spectral width after passing through each device in cavity
    Fig. 3. Evolution of steady dissipative soliton in cavity. (a) Pulses and (b) spectra in each position of cavity; (c) pulses and (d) spectra after passing through each device in cavity, insert graph is enlarged details; (e) change of spectral width after passing through each device in cavity
    Output characteristics when cavity's parameters are changed after laser is balanced. Output (a) pulses and (b) spectra with different QDF's lengths; output (c) pulses and (d) spectra of different QDF's doping concentrations, insert graph is enlarged details; output (e) pulses and (f) spectra with different SMF's lengths
    Fig. 4. Output characteristics when cavity's parameters are changed after laser is balanced. Output (a) pulses and (b) spectra with different QDF's lengths; output (c) pulses and (d) spectra of different QDF's doping concentrations, insert graph is enlarged details; output (e) pulses and (f) spectra with different SMF's lengths
    Multi-wavelength laser output when SMF length is 0.1 m. Output (a) pulses and (b) spectra of multi-wavelength laser
    Fig. 5. Multi-wavelength laser output when SMF length is 0.1 m. Output (a) pulses and (b) spectra of multi-wavelength laser
    ParameterDataParameterData
    σa,P /m23.8×10-20σa,L /m20.25×10-20
    σe,P /m20σe,L /m21.5×10-20
    ΓP0.4ΓL0.6
    λP /nm980λL /nm1700
    Area /m27.85×10-11τ /ns300
    Table 1. Parameters in rate equation[20-21]
    DeviceParameterDataDeviceParameterData
    SMFz /m4QDFz /m0.4
    β2 /(ps2·km-120β2 /(ps2·km-120
    γ /(km·W)-12.5γ /(km·W)-12
    SAα00.1ISOTransmittance90%
    αns0.2OCSplit ratio90∶10
    Psat /W25LDPower /W0.1
    FilterBandwidth /nm100All devicesWorking wavelength /nm1700
    Table 2. Parameters of devices of laser
    QDF length /mPeak power /W
    Doping concentration is 6×10²¹ m-3Doping concentration is 7×10²¹ m-3Doping concentration is 8×10²¹ m-3Doping concentration is 9×10²¹ m-3Doping concentration is 10×1021 m-3Doping concentration is 11×1021 m-3Doping concentration is 12×1021 m-3
    0.20.4320.5110.5670.6210.6560.7290.781
    0.30.5450.6290.6940.7590.8240.8340.866
    0.40.6660.7280.8050.8370.8020.7360.634
    0.50.7710.8240.7910.6860.5740.4820.375
    0.60.7910.7650.5960.4240.3420.407-
    Table 3. Peak power of different lengths and doping concentrations of QDF
    QDF length /mEnergy /pJ
    Doping concentration is 6×10²¹ m-3Doping concentration is 7×10²¹ m-3Doping concentration is 8×10²¹ m-3Doping concentration is 9×10²¹ m-3Doping concentration is 10×1021 m-3Doping concentration is 11×1021 m-3Doping concentration is 12×1021 m-3
    0.271.884.994.2102.9108.6120.0128.0
    0.392.7106.8117.2127.6137.5139.1143.9
    0.4115.4125.5137.8142.7137.3126.8110.0
    0.5135.5143.8138.6121.4102.285.966.9
    0.6141.7137.3108.277.262.474.2
    Table 4. Energy of different lengths and doping concentrations of QDF
    Rui Di, Kaihua Wei, Lingyun Xue, Lei Zhu, Qingguang Chen. Numerical Investigation of All-Normal Dispersion Mode-Locked PbSe Quantum Dot Fiber Laser[J]. Laser & Optoelectronics Progress, 2023, 60(7): 0714007
    Download Citation