• Photonics Research
  • Vol. 6, Issue 9, 867 (2018)
Jian Liu1、2、3 and Ka-Di Zhu1、2、3、*
Author Affiliations
  • 1Key Laboratory of Artificial Structures and Quantum Control (Ministry of Education), Shanghai 200240, China
  • 2School of Physics and Astronomy, Shanghai Jiao Tong University, Shanghai 200240, China
  • 3Collaborative Innovation Center of Advanced Microstructures, Nanjing 210000, China
  • show less
    DOI: 10.1364/PRJ.6.000867 Cite this Article Set citation alerts
    Jian Liu, Ka-Di Zhu. Room temperature optical mass sensor with an artificial molecular structure based on surface plasmon optomechanics[J]. Photonics Research, 2018, 6(9): 867 Copy Citation Text show less
    (a) Schematic diagram of the suspended graphene nanoribbon placed in the surface plasmonic cavity with presence of a strong pump beam and a weak probe beam; G points the direction of the gravity. The Ne atoms are deposited onto the surface of the graphene sheet in a special evaporator. (b) Displacement pattern of the atoms in the graphene nanoribbon due to the fundamental in-plane flexural resonance mode.
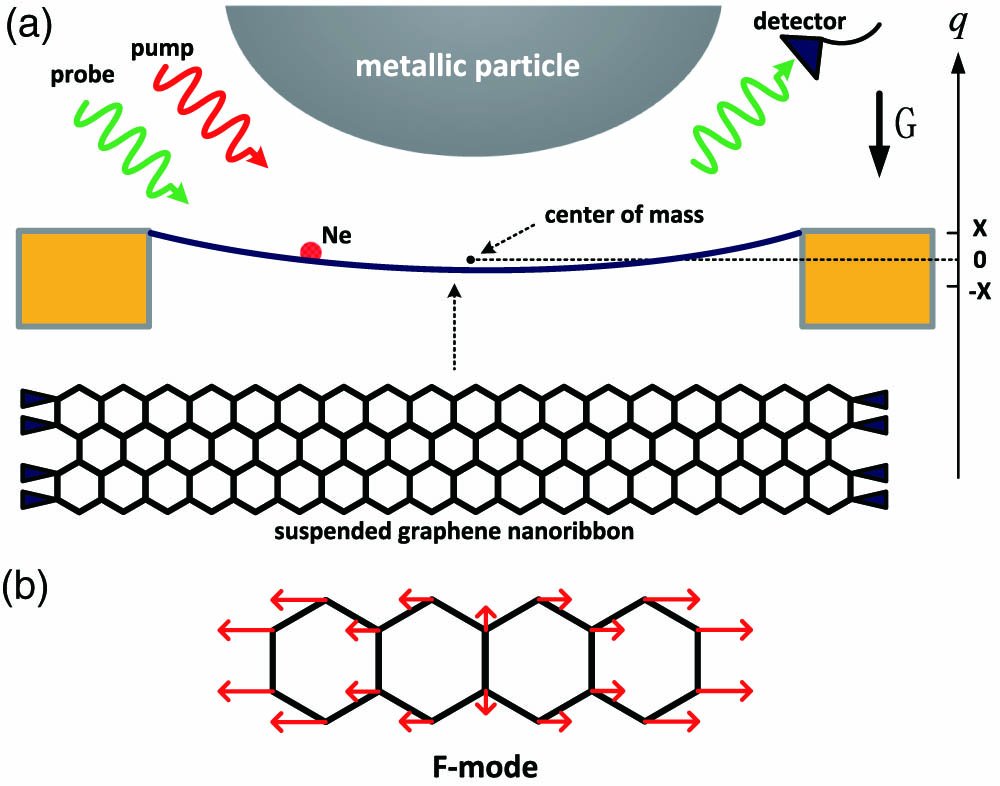
    Fig. 1. (a) Schematic diagram of the suspended graphene nanoribbon placed in the surface plasmonic cavity with presence of a strong pump beam and a weak probe beam; G points the direction of the gravity. The Ne atoms are deposited onto the surface of the graphene sheet in a special evaporator. (b) Displacement pattern of the atoms in the graphene nanoribbon due to the fundamental in-plane flexural resonance mode.
    Energy level diagram of the SGR-plasmon optomechanical system, where M and c denote the number states of mechanical mode and plasmon cavity photon, respectively. The three pictures correspond to the physical processes of (a) Stokes scattering, (b) Rayleigh scattering, and (c) anti-Stokes scattering.
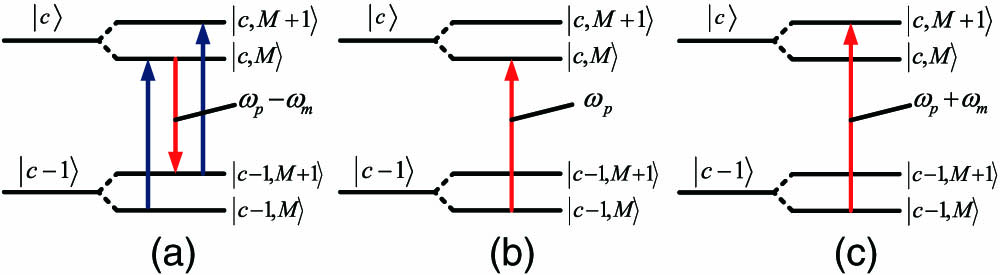
    Fig. 2. Energy level diagram of the SGR-plasmon optomechanical system, where M and c denote the number states of mechanical mode and plasmon cavity photon, respectively. The three pictures correspond to the physical processes of (a) Stokes scattering, (b) Rayleigh scattering, and (c) anti-Stokes scattering.
    Strength of Rayleigh scattering on the probing absorption spectrum as a function of the probe-pump detuning δc for different quality factors of the plasmon. We set Ep=0; other parameter values are Ωs=0.1 THz, γ=0.5 GHz.
    Fig. 3. Strength of Rayleigh scattering on the probing absorption spectrum as a function of the probe-pump detuning δc for different quality factors of the plasmon. We set Ep=0; other parameter values are Ωs=0.1  THz, γ=0.5  GHz.
    Plot of absorption spectrum as a function of probe-pump detuning with R=103 Å4·amu−1, g=200 GHz, Qc=10, and Δp=0 for I=1,2,and 3 kW/cm2, respectively. Other parameter values are the same as in Fig. 3.
    Fig. 4. Plot of absorption spectrum as a function of probe-pump detuning with R=103  Å4·amu1, g=200  GHz, Qc=10, and Δp=0 for I=1,2,and3kW/cm2, respectively. Other parameter values are the same as in Fig. 3.
    Pump intensity dependence of the ratio between Raman and Rayleigh scattering strength with different optomechanical coupling rate g.
    Fig. 5. Pump intensity dependence of the ratio between Raman and Rayleigh scattering strength with different optomechanical coupling rate g.
    Absorption spectra of the probe pulse as a function of δ before (black line) and after the binding events of one Ne atom (blue line) and 10 atoms (red line). The frequency shifts induced by additional masses can be well distinguished in the spectra. Here we choose R=103 Å4 ·amu−1, I=1 kW/cm2. Other parameters used are the same as in Fig. 4.
    Fig. 6. Absorption spectra of the probe pulse as a function of δ before (black line) and after the binding events of one Ne atom (blue line) and 10 atoms (red line). The frequency shifts induced by additional masses can be well distinguished in the spectra. Here we choose R=103  Å4·amu1, I=1  kW/cm2. Other parameters used are the same as in Fig. 4.
    ParameterUnitsValue
    Width of SGR, wnm0.7
    Length of the SGR, lnm6
    Fundamental frequency of SGR, ωmGHz100
    Frequency of the plasmon, ωcTHz330
    Raman activity of F-mode, RÅ4  ·amu1103104
    Volume of plasmon cavity, Vcμm31.5×106
    Quality factor for SGR, QSGNull200
    Quality factor for plasmon, QcNull10
    Conservative quantum yield, ηNull0.01
    Pump-cavity detuning, ΔpHz0
    Air pressure, PTorr1
    Temperature, TK300
    Table 1. Parameters of the Plasmon Optomechanical System Used in the Mass Measurement
    Jian Liu, Ka-Di Zhu. Room temperature optical mass sensor with an artificial molecular structure based on surface plasmon optomechanics[J]. Photonics Research, 2018, 6(9): 867
    Download Citation