• Chinese Optics Letters
  • Vol. 16, Issue 11, 113302 (2018)
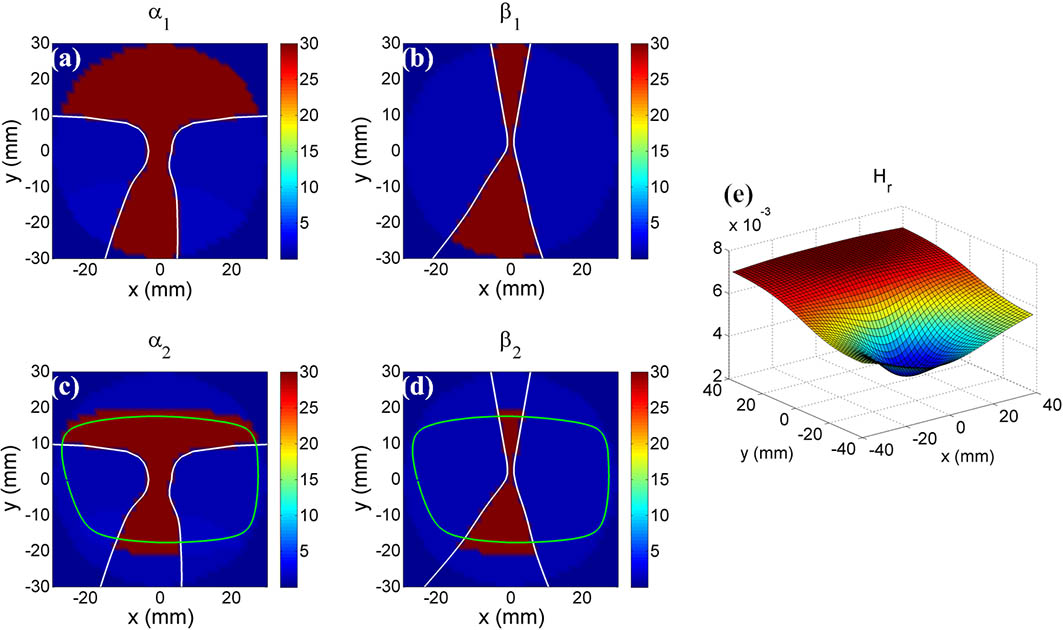
Yiyu Li1、2、*, Wei Huang1, Haihua Feng1、2, and Jiaojie Chen1、2
Author Affiliations
  • 1School of Optometry and Ophthalmology, Wenzhou Medical University, Wenzhou 325027, China
  • 2The Eye Hospital of Wenzhou Medical University, Wenzhou 325027, China
  • show less
    DOI: 10.3788/COL201816.113302 Cite this Article Set citation alerts
    Yiyu Li, Wei Huang, Haihua Feng, Jiaojie Chen. Customized design and efficient machining of astigmatism-minimized progressive addition lens[J]. Chinese Optics Letters, 2018, 16(11): 113302 Copy Citation Text show less
    Functions used in DOF: (a) α1(x,y) and (b) β1(x,y) are weight functions in PAL-I design for astigmatism and spherical power, respectively; (c) α2(x,y) and (d) β2(x,y) are weight functions in PAL-II design; (e) the desired mean curvature Hr(x,y) of the real surface.
    Fig. 1. Functions used in DOF: (a) α1(x,y) and (b) β1(x,y) are weight functions in PAL-I design for astigmatism and spherical power, respectively; (c) α2(x,y) and (d) β2(x,y) are weight functions in PAL-II design; (e) the desired mean curvature Hr(x,y) of the real surface.
    Zernike coefficients of the PAL rear surface. The perturbation surfaces represent the deviation of the rear surface from a spherical background surface with a radius of curvature of 200 mm.
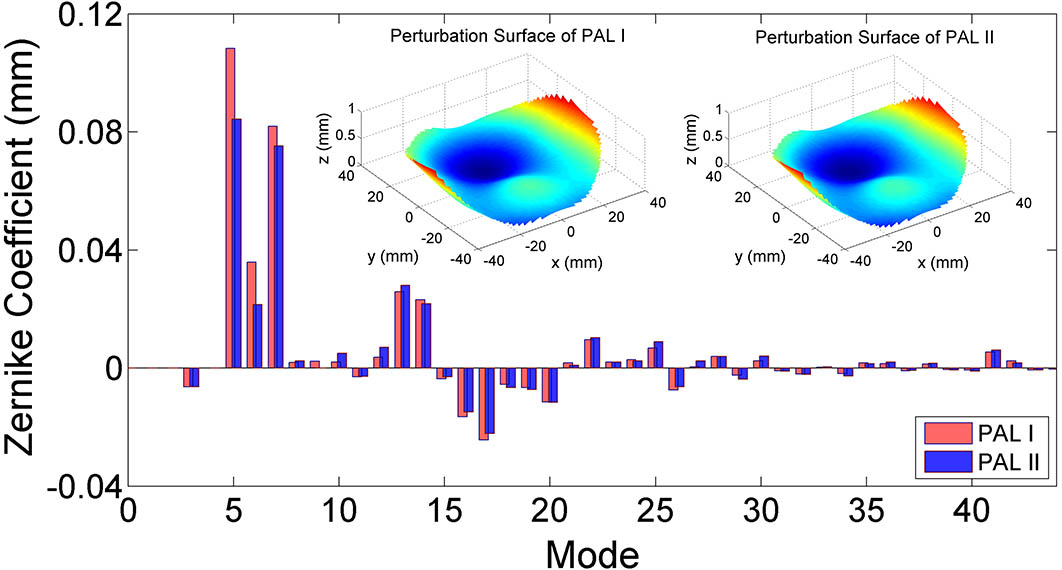
    Fig. 2. Zernike coefficients of the PAL rear surface. The perturbation surfaces represent the deviation of the rear surface from a spherical background surface with a radius of curvature of 200 mm.
    Simulated power distribution of the PAL. (a) Spherical power and (b) astigmatism of PAL-I with the dashed black contour representing the virtual spectacle frame; (c) spherical power and (d) astigmatism of PAL-II with the solid black contour representing the border of the real frame applied. DRP and NRP are marked with black rings in the distance and near zones, respectively.
    Fig. 3. Simulated power distribution of the PAL. (a) Spherical power and (b) astigmatism of PAL-I with the dashed black contour representing the virtual spectacle frame; (c) spherical power and (d) astigmatism of PAL-II with the solid black contour representing the border of the real frame applied. DRP and NRP are marked with black rings in the distance and near zones, respectively.
    Comparison of the normalized frame area occupied by a specific range of spherical power or astigmatism between PAL-I and PAL-II. Sph: spherical power; Astig: astigmatism.
    Fig. 4. Comparison of the normalized frame area occupied by a specific range of spherical power or astigmatism between PAL-I and PAL-II. Sph: spherical power; Astig: astigmatism.
    Simulated power distribution of PAL-I and PAL-II with a design philosophy ranging from the hardest type-I to the softest type-IV. The near zone was gradually narrowed from type-I to type-IV, while the distance zone remained almost unchanged. The results of type-II design have already been shown in Fig. 3.
    Fig. 5. Simulated power distribution of PAL-I and PAL-II with a design philosophy ranging from the hardest type-I to the softest type-IV. The near zone was gradually narrowed from type-I to type-IV, while the distance zone remained almost unchanged. The results of type-II design have already been shown in Fig. 3.
    Flowchart of freeform PAL manufacture.
    Fig. 6. Flowchart of freeform PAL manufacture.
    Spiral tool trajectory for machining the PAL surface. For visualization purpose, a large feed distance of 1.5 mm per revolution is used.
    Fig. 7. Spiral tool trajectory for machining the PAL surface. For visualization purpose, a large feed distance of 1.5 mm per revolution is used.
    Frequency spectrum of the tool motion at a spindle working speed of 1000 r/min. Red line: frequency spectrum of the recorded response signals of the FTS in the experiment. Blue dot line: frequency spectrum of the command signals of the FTS transformed from the tool path calculation. The insert maps show the command tool path with a feed distance of 1 mm per revolution just for demonstration.
    Fig. 8. Frequency spectrum of the tool motion at a spindle working speed of 1000 r/min. Red line: frequency spectrum of the recorded response signals of the FTS in the experiment. Blue dot line: frequency spectrum of the command signals of the FTS transformed from the tool path calculation. The insert maps show the command tool path with a feed distance of 1 mm per revolution just for demonstration.
    Diamond machining of the PAL rear surface with the FTS.
    Fig. 9. Diamond machining of the PAL rear surface with the FTS.
    Measured surface power of the PALs. (a) Spherical power and (b) astigmatism of PAL-I with a dashed black contour representing the border of the virtual spectacle frame. (c) Spherical power and (d) astigmatism of PAL-II with a solid black contour representing the border of the real frame applied in the lens design.
    Fig. 10. Measured surface power of the PALs. (a) Spherical power and (b) astigmatism of PAL-I with a dashed black contour representing the border of the virtual spectacle frame. (c) Spherical power and (d) astigmatism of PAL-II with a solid black contour representing the border of the real frame applied in the lens design.
    Yiyu Li, Wei Huang, Haihua Feng, Jiaojie Chen. Customized design and efficient machining of astigmatism-minimized progressive addition lens[J]. Chinese Optics Letters, 2018, 16(11): 113302
    Download Citation