Astigmatism is inevitable and inherent to progressive addition lenses (PALs), which are typically distributed in the lateral areas on both sides of the progressive corridor. In this study, we took into account the spectacle frame for the customized freeform PAL design with the variational-difference numerical approach. The PAL surface with minimized astigmatism, approximately equal to 84% of the added power, was numerically resolved without expending the zone for clear vision. We validated our approach by experimentally demonstrating the procedure from tool path generation to surface power measurement, thus providing an efficient solution to the personalization of astigmatism-minimized PAL design and manufacture.
The progressive addition lens (PAL), commonly used to correct presbyopia[1–3] or to slow down the progression of juvenile myopia[4,5], is now widely adopted in optometric studies. The lens power varies progressively from a minimum value at the distance zone to a maximum value at the near zone, providing the required addition for near vision without any vision jump phenomenon. However, the addition of power causes lateral aberrations, especially the irregular astigmatism distributed in the lateral zone on both sides of the corridor[6]. An efficient and customizable design method that aims to reduce astigmatism and optimize other PAL features is very promising.
The direct methods of PAL design were first proposed in the Refs. [7–9]. However, the performance is far from satisfaction because of the lack of effective control over the distribution of astigmatism. Recently, indirect methods such as the variational approach[10–13] were proposed to balance the power distribution with unwanted astigmatism. However, it is time consuming to construct the optimal weight function for each personalized PAL.
In this Letter, we apply the spectacle frame function to the design objective function (DOF) in PAL design with the variational-difference method for the first time, to our knowledge, and subsequently simplify the configuration of weight functions for optimization. We show in both simulations and experiments that the required surface power distribution and the minimization of unwanted astigmatism can be achieved simultaneously, therefore facilitating the development of novel personalized PALs.
Sign up for Chinese Optics Letters TOC. Get the latest issue of Chinese Optics Letters delivered right to you!Sign up now
For the PAL discussed in this Letter, the front convex surface is spherical while the progressive power is achieved by smoothly changing the mean curvature of the rear surface, which is inherently freeform. Suppose that the principal curvatures[14] of the rear surface are given by and for , which is a bounded domain. The mean curvature can be defined as Thus, the surface spherical power is defined as where is the refractive index of the material. The difference between the two principal curvatures is related to astigmatism, defined as In order to fit the desired distribution of the surface spherical power while minimizing the total astigmatism, the DOF can be evaluated as where is the desired mean curvature and and are two positive weight functions for astigmatism and spherical power, respectively. A large weight should be assigned, if minimum astigmatism or accurate spherical power is required.
To constrain the DOF minimization problem inside the spectacle frame zone, a frame function is utilized to modify Eq. (4). Thus, we get
The shape and size of spectacle frame are chosen by the wearer, so the frame function is personalized. We specified the frame zone by connecting a series of coordinate points along the frame boundary. For comparison, we employed Eq. (4) for PAL-I design without frame function and Eq. (5) for PAL-II design with frame function applied, respectively, in the following sections.
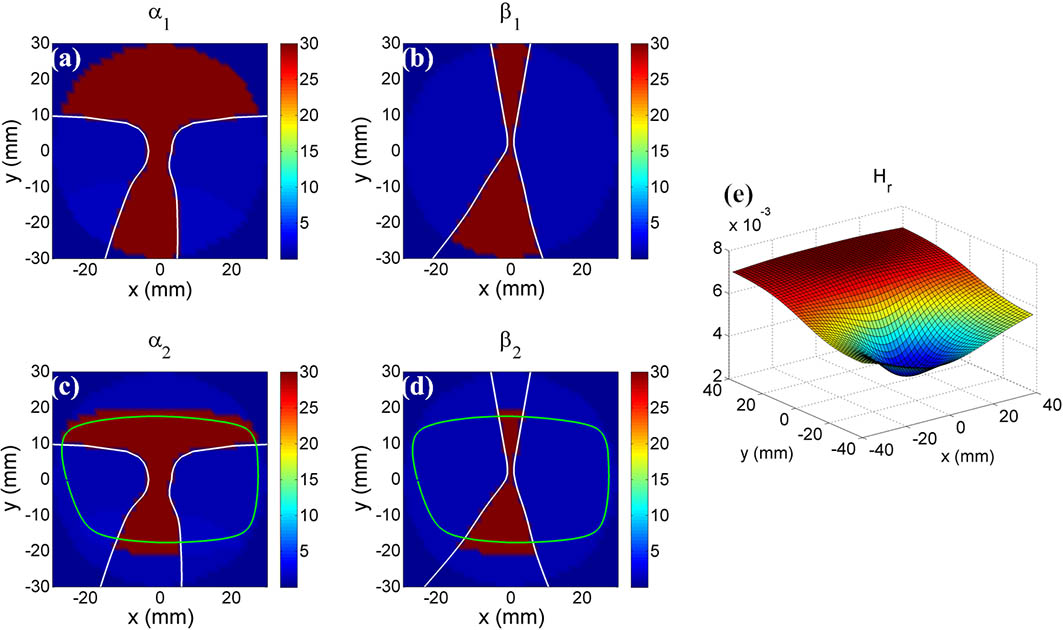
The aperture of the finished PAL will be circular with a diameter of 60 mm, so the computational domain was set to be and divided into three subregions, as shown in Fig. 1. For PAL-I design, the red subregion with the highest weight in was used for the clear vision zone. In the case of , the red subregion covered a much smaller portion of the distance zone and a relatively large portion of the near zone. Note that the distance reference point (DRP) and the near reference point (NRP) must be covered by these red subregions. To achieve the inset of the near zone, the lower portions of the red subregions were linearly shifted 2.5 mm to the nasal side. The difference in the weight functions of PAL-II design is that the region that is beyond the frame border but inside the circular lens aperture was reset to be a constant one.
Figure 1.Functions used in DOF: (a) and (b) are weight functions in PAL-I design for astigmatism and spherical power, respectively; (c) and (d) are weight functions in PAL-II design; (e) the desired mean curvature of the real surface.
The assignment of the mean curvature , as shown in Fig. 1(d), is based on the patient’s prescription. For an emmetropic patient suffering from presbyopia of 2.00 diopter, the PAL can be designed with a distance correction of 0.00 diopter and a diopter added. For all the simulations, we chose the refractive index , lens thickness , and 4.00 diopter of the front surface. Thus, the required mean curvatures of the rear surface at DRP and NRP were calculated to be and , respectively. The progressive curvatures along the corridor from DRP to NRP were assigned by fitting a polynomial, as proposed in Refs. [7,8]. Then, for each of the other points on the rear surface, the mean curvature was assigned according to the ratio of their distances from the DRP and the NRP.
Before the numerical optimization, a linearization approach[12] was first adopted to divide the rear surface into two parts: a spherical background surface with a radius of curvature of 200 mm and a perturbation surface. Then, the variational-difference method[13] was used to solve the DOF minimization problem to obtain the perturbation surface shown in the insert maps of Fig. 2. The combination of the perturbation surface and spherical background surface gives the real surface of the PAL.
Figure 2.Zernike coefficients of the PAL rear surface. The perturbation surfaces represent the deviation of the rear surface from a spherical background surface with a radius of curvature of 200 mm.
By using the least-squares method, the real surface was fit to a set of Zernike polynomials[15–19] defined in Cartesian coordinates as where is the Zernike coefficient of each term with order and meridional frequency [20]. The single indexing scheme of was adopted in this work. Figure 2 plots with bars except and . The larger coefficient of (classically named vertical astigmatism) in PAL-I indicates the higher level of surface astigmatism.
At each point on the rear surface the spherical power and astigmatism, calculated using Eq. (2) and Eq. (3), respectively, were combined with the spherical power of the front surface to give the final power distribution of the PAL as shown in Fig. 3. The “hard” design philosophy characterized by the wide distance zone and rapidly increasing levels of astigmatism was found in PAL-I, with the maximum astigmatism being close to the value of added power inside the virtual frame zone. In the case of PAL-II, the maximum astigmatism inside the frame zone dropped to 1.68 diopter, which is equal to 84% of the added power.
Figure 3.Simulated power distribution of the PAL. (a) Spherical power and (b) astigmatism of PAL-I with the dashed black contour representing the virtual spectacle frame; (c) spherical power and (d) astigmatism of PAL-II with the solid black contour representing the border of the real frame applied. DRP and NRP are marked with black rings in the distance and near zones, respectively.
Figure 4 depicts the ratio of the frame area possessing a specific range of spherical power or astigmatism. The area with astigmatism less than 0.50 diopter is the same for PAL-I and PAL-II, indicating that the clear vision zone remains almost unchanged. Additionally, the area with spherical power ranging from 0.50 to 0.75 diopter was extended in PAL-II so that a lower gradient of spherical power in the blending zone could bring benefits toward the minimization of astigmatism in the same area.
Figure 4.Comparison of the normalized frame area occupied by a specific range of spherical power or astigmatism between PAL-I and PAL-II. Sph: spherical power; Astig: astigmatism.
PAL design is often classified as “hard” or “soft” design based on the distribution of astigmatism. A “harder” PAL design concentrates the astigmatism into smaller regions of the lens surface, thereby expanding the area of clear vision at the expense of raising unwanted astigmatism levels in the periphery. A “softer” PAL design spreads the astigmatism across larger regions of the lens surface, thereby reducing the overall magnitude of unwanted astigmatism at the expense of narrowing the clear vision zones. To verify the applicability and flexibility of the proposed method for different design philosophies, we changed the weight functions by adjusting the area of the red subregion shown in Fig. 1. For example, enlarging the near zone by the same ratio for and to ensure a wider field of near vision results in the “hardest” type-I design, as shown in Fig. 5. We can also decrease the size of the near zone to release more area for “blending” the distance and near zones leading to the “softer” type-III design and the “softest” type-IV design. In all the cases, PAL-II with a frame function applied demonstrated the better performance with a lower level of astigmatism.
Figure 5.Simulated power distribution of PAL-I and PAL-II with a design philosophy ranging from the hardest type-I to the softest type-IV. The near zone was gradually narrowed from type-I to type-IV, while the distance zone remained almost unchanged. The results of type-II design have already been shown in Fig. 3.
Note that PAL-II design has suppressed the astigmatism to its theoretical limit, since slight improvement can be observed in the type-IV design that has the largest blending zone with the lowest gradient of spherical power. The maximum astigmatism inside the frame zone is restricted to 88.6% and 83.8% of the added power value for the “hardest” and “softest” designs of PAL-II, respectively. There are other ways to suppress astigmatism further, such as decreasing the distance zone or extending the corridor length. The superiority of our approach, which utilizes the frame function in the variational-difference method, is that the simple pattern of weight functions is suitable for most of the PAL design philosophies and the possibility to arrive quickly at the numerical solution with minimized astigmatism.
Due to the freeform feature of the PAL surface, the fast tool servo (FTS) assisted diamond turning method was used for the surface machining[21]. The arrangement of the PAL manufacture is illustrated in Fig. 6. Since the rear surface has been fit by Zernike polynomials in a circular aperture, any point on the tool path can be calculated efficiently. The tool path is generated via azimuth sampling on the freeform surface, as shown in Fig. 7. A proprietary software was developed by using MATLAB to process the coordinate data of the PAL surface into an appropriate format for machining. The software calculated the surface in at least supporting points in a polar mesh to transfer the 3D surface data with the freeform features into a point cloud data file.
To suppress form error, a hybrid constant-arc and constant-angle sampling method was used to determine the tool tip location. First, a circumferential interval of was set in the constant-arc method. Until the corresponding angular interval became larger than the threshold of , the constant-angle method was adopted instead to rule the control nodes. The feed distance was set to be 25 μm per spindle revolution. To account for the cutting-edge geometry, the tool radius compensation could be considered. However, the amount of tool radius compensation, usually measured in microns, has a trifling impact on the surface power measured in diopters, and therefore can be neglected. The maximum range of the calculated tool motion in one revolution was 0.788 mm, which is within the stroke range of the FTS.
The fast Fourier transform method was used to analyze the frequency spectrum of the tool motion, as shown in Fig. 8. The base frequency was defined as 16.7 Hz, since the spindle speed was chosen to be 1000 r/min. The frequency spectrum of the response signals recorded in the experiment was compared to that of the command signals derived from the tool path calculation. It can be seen that the envelope of the lower boundary of the frequency spectrum in the experiment matches well with the theoretical calculation. The discrepancies in the amplitude between the two frequency spectra demonstrate the tracking error, mostly due to the inertia of the FTS and the inconsistent cutting conditions over the diameter of the lens blank. The overall tracking error was calculated to be 5.5 μm (rms) and 4.9 μm (rms) for PAL-I and PAL-II, respectively.
Figure 8.Frequency spectrum of the tool motion at a spindle working speed of 1000 r/min. Red line: frequency spectrum of the recorded response signals of the FTS in the experiment. Blue dot line: frequency spectrum of the command signals of the FTS transformed from the tool path calculation. The insert maps show the command tool path with a feed distance of 1 mm per revolution just for demonstration.
The diamond turning machine (DTM) with a long stroke FTS developed in the lab was used for PAL surface machining. As shown in Fig. 9, the DTM comprises three parts: a straight X axis slider, a Z axis FTS based on a voice coil actuator, and a main spindle (also called C-axis) installed on the X axis to rotate the workpiece. The stroke of the FTS is synchronized to the spindle and X axis linear servo to accomplish the complex tool motion for freeform surface machining.
Figure 9.Diamond machining of the PAL rear surface with the FTS.
A semi-finished lens blank made of CR39 and having a prefabricated front spherical surface was used as the workpiece. First, a milling cutter was used in the cribbing process to obtain the required lens aperture. Then, the diamond turning process was conducted to fabricate the freeform surface. The X-slider and the FTS feed in the radial and cutting depth direction, respectively, while the spindle provides the feed in the circumferential direction. A polycrystalline diamond tool and a mono-crystal diamond tool were used in the rough cutting with a cutting depth of 0.5 mm, and in the finishing with a cutting depth of 0.1 mm, respectively. The machining cycle is less than 2 min. Finally, the surface was polished using a flexible freeform polisher to remove the tool marks and to achieve a uniform polishing rate across the surface[22].
A spectacle lens inspection system (Rotlex, Class Plus) operating on the Moire interferometer was used to measure the power distribution shown in Fig. 10. The specifications of the PALs including the distance power, added power, corridor length, and amplitude of astigmatism match well with the theoretical design shown in Fig. 3. The deviation in the surface power between the measurement and the simulation is a sum of different error sources such as the tracking error of the FTS, over polishing, and absence of tool radius compensation. It is interesting to find that the corridor width between the two blending zones is wider in measurement than in the simulation, and therefore is beneficial for wearer adaptation.
Figure 10.Measured surface power of the PALs. (a) Spherical power and (b) astigmatism of PAL-I with a dashed black contour representing the border of the virtual spectacle frame. (c) Spherical power and (d) astigmatism of PAL-II with a solid black contour representing the border of the real frame applied in the lens design.
The experimental results demonstrate that the customized design and efficient machining of astigmatism-minimized PAL by our approach have been achieved successfully. When the lenses are edged into the shape of spectacle frame, PAL-II with lower levels of astigmatism is believed to be more acceptable to wearers.
In conclusion, we have demonstrated the new method to suppress the astigmatism of a customized PAL by employing the spectacle frame function in the variational approach. It allows for fast and easy construction of the simplified weight functions and is applicable to a variety of PAL design philosophies. The new PAL design shows the lowest level of astigmatism, approximately equal to 84% of the added power, and is compatible with the existing precision optical fabrication process; thus, our approach provides a flexible, reliable, and powerful solution to support the development of personalized PALs.