• Laser & Optoelectronics Progress
  • Vol. 59, Issue 19, 1930005 (2022)
Si Shen* and Meng Liu
Author Affiliations
  • Department of Forensic Science and Technology, Zhejiang Police College, Hangzhou 310053, Zhejiang, China
  • show less
    DOI: 10.3788/LOP202259.1930005 Cite this Article Set citation alerts
    Si Shen, Meng Liu. Few-Shot Classification of Laser-Printing Toner Using Infrared Spectroscopy[J]. Laser & Optoelectronics Progress, 2022, 59(19): 1930005 Copy Citation Text show less
    Infrared transmission spectra of laser printing toner
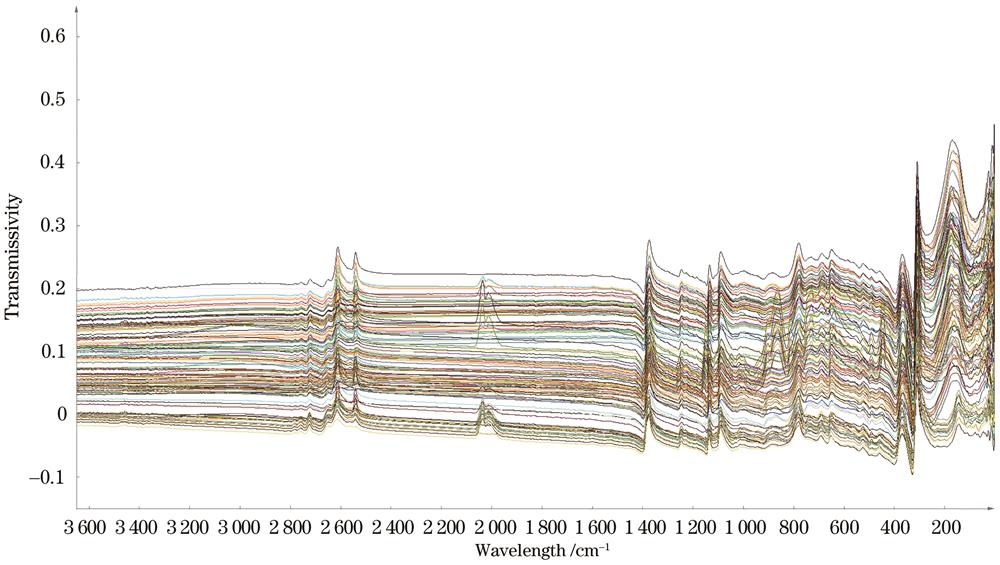
    Fig. 1. Infrared transmission spectra of laser printing toner
    ROC and AUC of toner’s PLS-DA model. (a) Testing set ratio is 1/5; (b) testing set ratio is 1/4; (c) testing set ratio is 1/3; (d) testing set ratio is 1/2
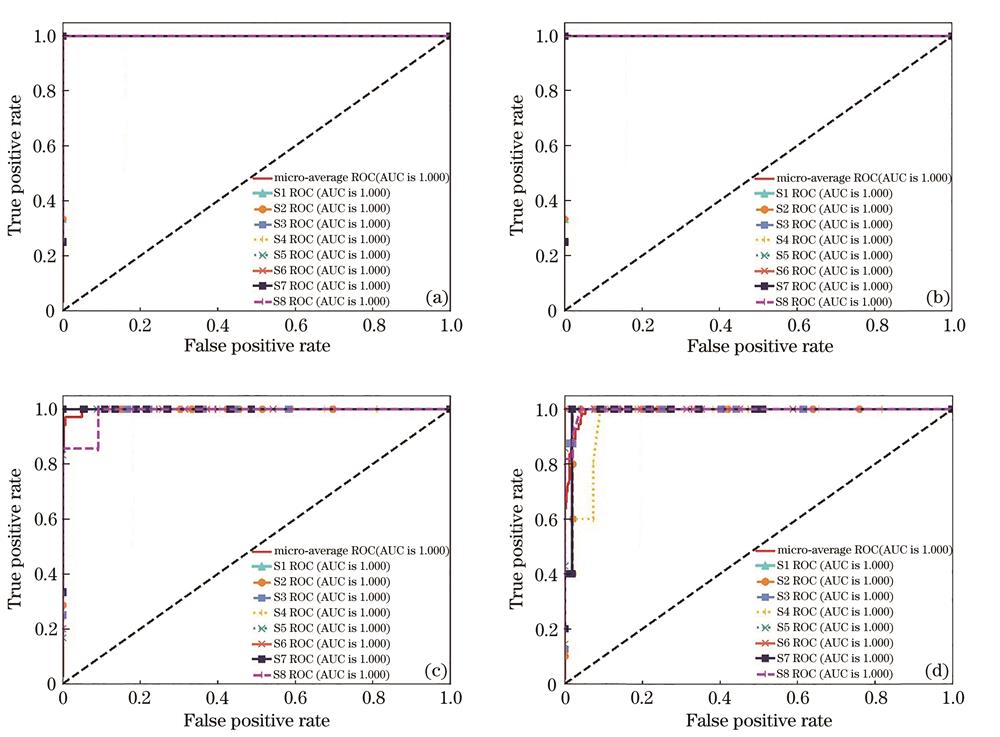
    Fig. 2. ROC and AUC of toner’s PLS-DA model. (a) Testing set ratio is 1/5; (b) testing set ratio is 1/4; (c) testing set ratio is 1/3; (d) testing set ratio is 1/2
    ROC and AUC of toner’s SVM model. (a) Testing set ratio is 1/5; (b) testing set ratio is 1/4; (c) testing set ratio is 1/3; (d) testing set ratio is 1/2
    Fig. 3. ROC and AUC of toner’s SVM model. (a) Testing set ratio is 1/5; (b) testing set ratio is 1/4; (c) testing set ratio is 1/3; (d) testing set ratio is 1/2
    ROC and AUC of toner’s RF model. (a) Testing set ratio is 1/5; (b) testing set ratio is 1/4; (c) testing set ratio is 1/3; (d) testing set ratio is 1/2
    Fig. 4. ROC and AUC of toner’s RF model. (a) Testing set ratio is 1/5; (b) testing set ratio is 1/4; (c) testing set ratio is 1/3; (d) testing set ratio is 1/2
    All training samples’ 3D score plot of PLS-DA model
    Fig. 5. All training samples’ 3D score plot of PLS-DA model
    S1 and S3 training samples’ 3D score plot of PLS-DA model
    Fig. 6. S1 and S3 training samples’ 3D score plot of PLS-DA model
    Variable influence on projection (VIP) of toner’s PLS-DA model
    Fig. 7. Variable influence on projection (VIP) of toner’s PLS-DA model
    Samples’ numberBrandTypeType of toner cartridge
    S1HPM202nC0388C
    S2CanonLBP6018LCRG 925
    S3CanonLBP6230DNCRG 326
    S4FUJI XEROXP268BCT202331
    S5HPM226DNC388A*
    S6HPM227C0388C
    S7HPP1106CF230A
    S8FUJI XEROXM188wDR1035
    Table 1. Information of laser printers
    Preprocessing methodNumber of main componentsR2YQ2Accuracy
    None120.8650.7470.875
    FD40.5290.4950.792
    SD100.9210.8101.000
    MSC90.7130.6390.833
    SNV30.3980.3860.500
    SG120.8570.7730.917
    FG+MSC110.8710.7611.000
    SD+MSC100.9210.8101.000
    FD+SNV50.6140.5600.958
    SD+SNV110.9270.7291.000
    FD+SG40.5290.4960.750
    SD+SG110.9380.8141.000
    FD+MSC+SG110.8670.7581.000
    SD+MSC+SG40.5040.4880.792
    FD+SNV+SG50.6140.5590.958
    SD+SNV+SG110.9230.7441.000
    Table 2. Performance comparison of spectral preprocessing methods
    Testing set ratioPLS-DASVMRF
    1/51.0000.9610.999
    1/41.0000.9530.998
    1/30.9980.9420.977
    1/20.9940.9340.972
    Table 3. Micro-average AUC of different toner discriminant models
    Testing set ratioPLS-DASVMRF
    1/51.0000.8750.917
    1/41.0000.9000.900
    1/30.9830.9170.917
    1/20.9500.8500.933
    Table 4. Testing accuracy of different toner discriminant models
    Testing set ratioFull spectrum PLS-DAVIP spectrum PLS-DAFull spectrum SVMVIP spectrum SVMFull spectrum RFVIP spectrum RF
    1/51.0000.9950.9610.9840.9990.998
    1/41.0000.9940.9530.9800.9980.998
    1/30.9980.9930.9420.9750.9770.996
    1/20.9940.9840.9340.9720.9720.994
    Table 5. Micro-average AUC of models based on full spectrum and VIP spectrum
    Si Shen, Meng Liu. Few-Shot Classification of Laser-Printing Toner Using Infrared Spectroscopy[J]. Laser & Optoelectronics Progress, 2022, 59(19): 1930005
    Download Citation