
Tai Guo, Yichun Dai, Dehua Yang, Bin Wang, Zhenyu Jin. Frequency Characteristics of Primary Mirror Control System in Segmented Ring Solar Telescope[J]. Acta Optica Sinica, 2018, 38(11): 1122001
- Acta Optica Sinica
- Vol. 38, Issue 11, 1122001 (2018)
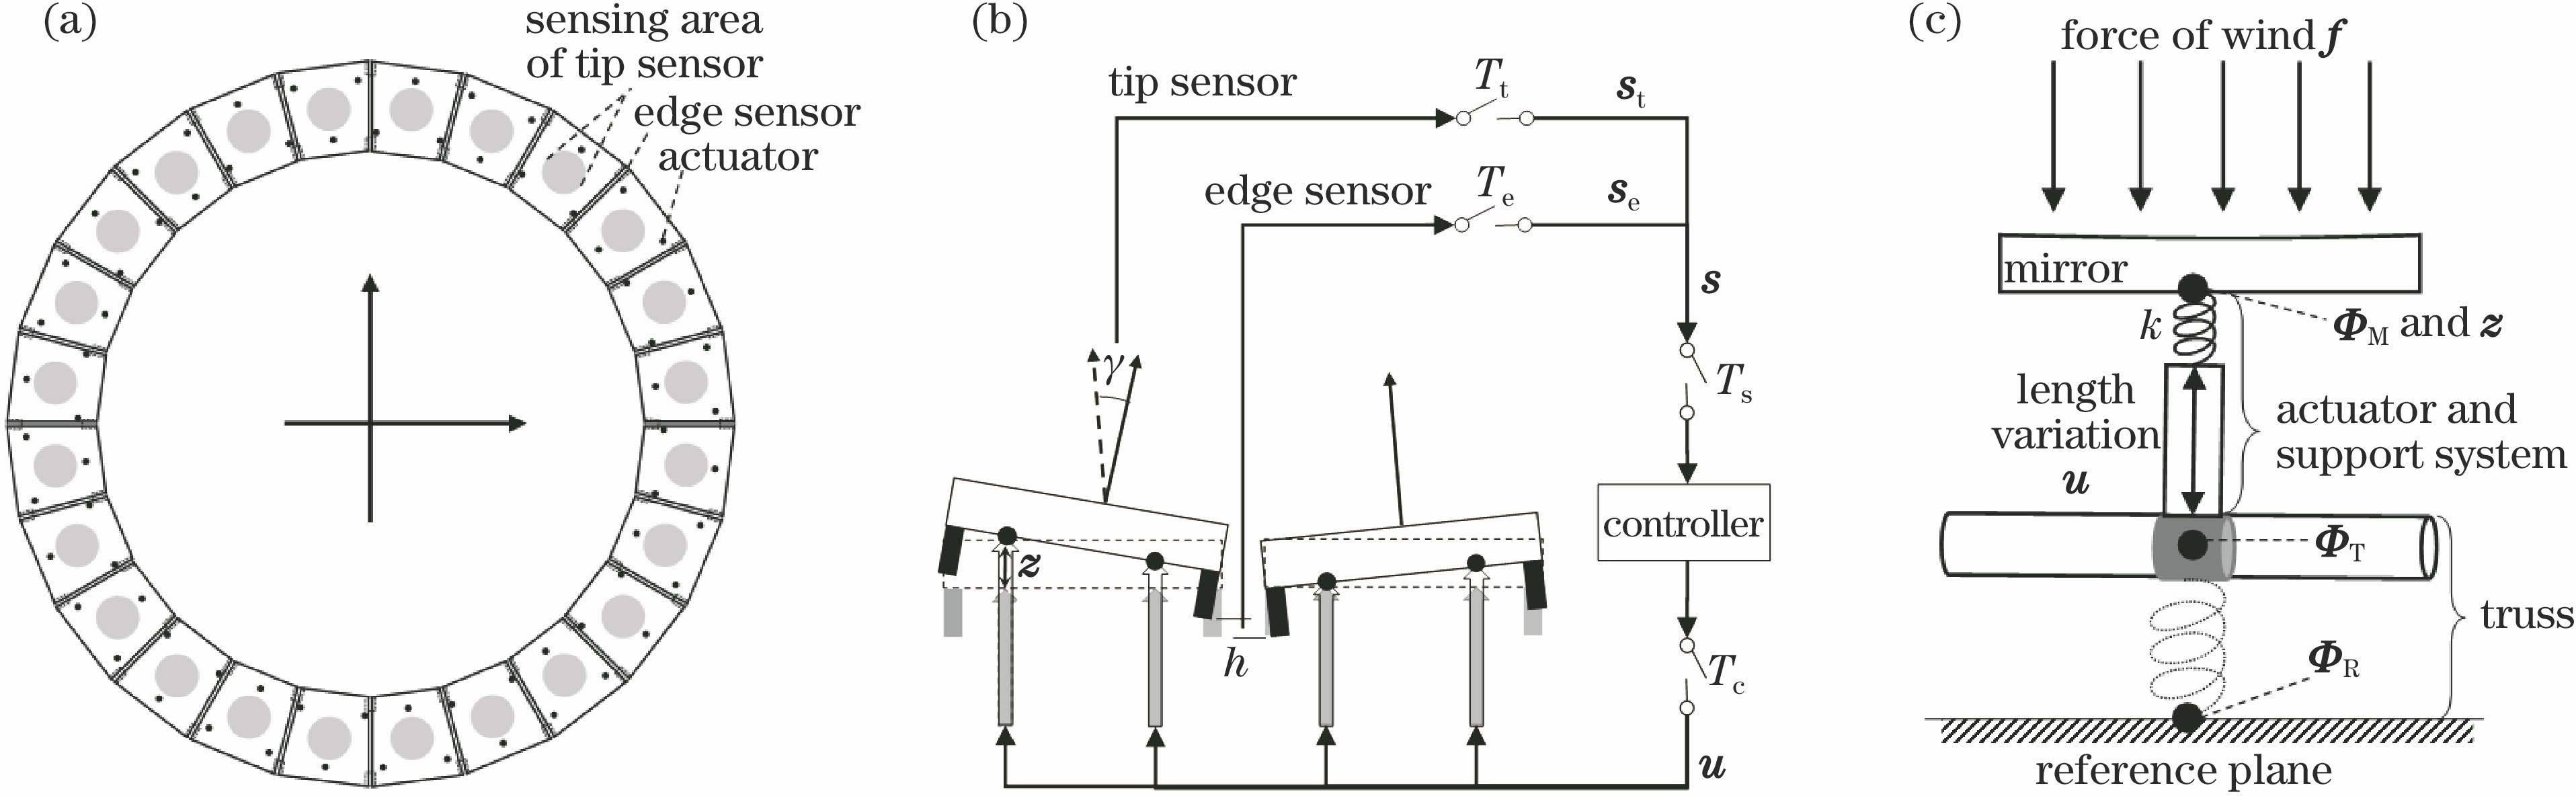
Fig. 1. Schematic of 8-m-RST primary mirror system. (a) Top view; (b) sensor, controller and actuator; (c) segmented mirror, support system, actuator and truss
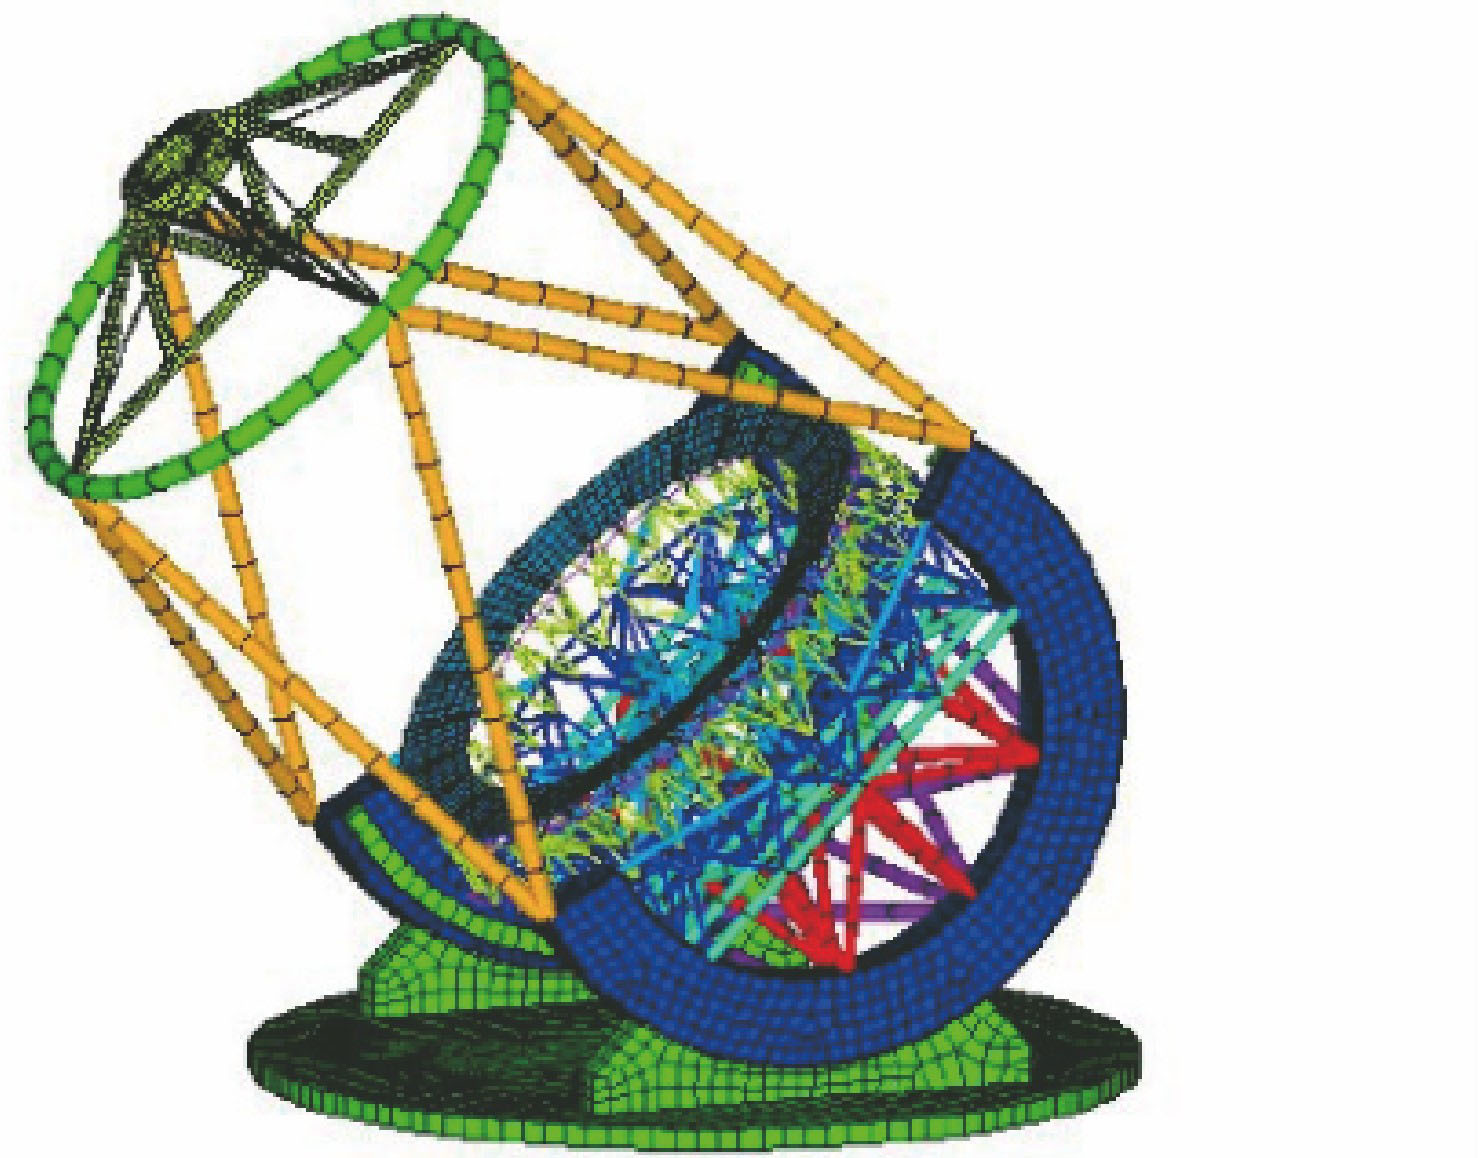
Fig. 2. Finite element model of 8-m-RST
Fig. 3. Schematic of pulsed wind speed field
Fig. 4. Two unobservable control modes of primary mirror system. (a) Focus mode; (b) global axial translation mode
Fig. 5. Schematic of synchronous sampling for edge and tilt sensors
Fig. 6. Modeling chart of primary mirror and its control system
Fig. 7. Bode diagram of open-loop system. (a) Input: mode 1, output: mode 1 and mode 2; (b) 72 modes
Fig. 8. Two most sensitive control modes of primary mirror system in 8-m-RST. (a) Mode 1; (b) mode 2
Fig. 9. Bode diagram of system. (a) Continuous time system; (b) discrete time system; (c) Bode diagrams of open-loop and closed-loop systems for mode 1
Fig. 10. Step response for mode 1
Fig. 11. Nichols chart of unity gain system. (a) Continuous time system; (b) discrete time system (sampling period is 0.1 s)
Fig. 12. Nichols charts of system when relative stablity requirment is satisfied. (a) Continuious time system, integral gain of 3.3; (b) samping time of 0.05 s, integral gain of 2.0; (c) samping time of 0.1 s,integral gain of 1.3; (d) samping time of 0.2 s, integral gain of 0.71
Fig. 13. Spectrum of pulsed wind speed field
Fig. 14. Bode diagram of disturbance input for primary mirror control system. (a) Open-loop state; (b) closed-loop state
Fig. 15. Step response of disturbance input for mode 1 as example
Fig. 16. Error signals under wind disturbance. (a) Error of Mode 1; (b) error of mode 67; (c) error of actuator; (d) RMSE of actuators
Fig. 17. Mode 67
Fig. 18. Power spectra of error signals under wind disturbance. (a) Mode 1; (b) mode 67; (c) actuator; (d) RMSE
|
Table 1. Sampling period, integral gain and control bandwidth for 4 systems in Fig. 12

Set citation alerts for the article
Please enter your email address
© Copyright 2018-2021 | Chinese Laser Press. All Rights Reserved 沪ICP备15018463号-20