• Laser & Optoelectronics Progress
  • Vol. 60, Issue 7, 0730004 (2023)
Jiguang Jiang1、**, Lei Shi1, Chengzhi Su2、*, Chuan Chang1, Xiaotian Li1, Xiaolong Hou1, and Aixin Tian1
Author Affiliations
  • 1College of Mechanical and Electrical Engineering, Changchun University of Science and Technology, Changchun 130022, Jilin, China
  • 2Artificial Intelligence Research Institute, Changchun University of Science and Technology, Changchun 130022, Jilin, China
  • show less
    DOI: 10.3788/LOP220700 Cite this Article Set citation alerts
    Jiguang Jiang, Lei Shi, Chengzhi Su, Chuan Chang, Xiaotian Li, Xiaolong Hou, Aixin Tian. Decoupled Prediction Method for Water Pollutant Concentration Based on SPA-SVR Using Ultraviolet Spectroscopy[J]. Laser & Optoelectronics Progress, 2023, 60(7): 0730004 Copy Citation Text show less
    Flow chart of coupling parameters detection model
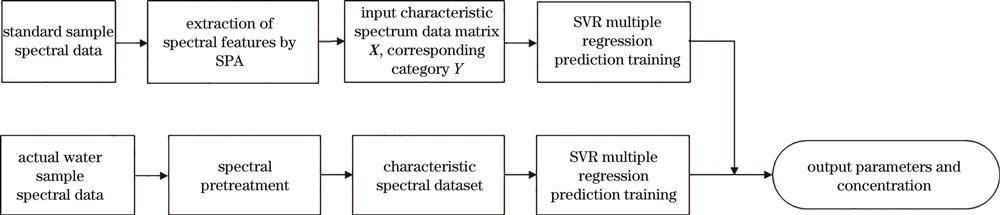
    Fig. 1. Flow chart of coupling parameters detection model
    Ultraviolet spectrum detection system
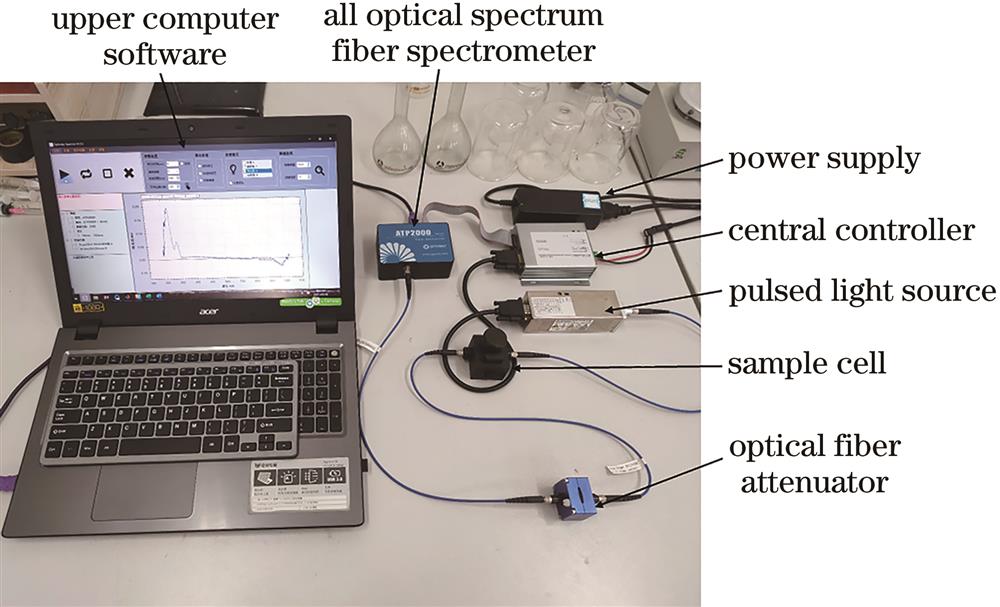
    Fig. 2. Ultraviolet spectrum detection system
    UV absorption spectra of standard solution. (a) COD; (b) turbidity
    Fig. 3. UV absorption spectra of standard solution. (a) COD; (b) turbidity
    UV absorption spectra of mixed solution. (a) COD+turbidity interference; (b) turbidity+COD interference
    Fig. 4. UV absorption spectra of mixed solution. (a) COD+turbidity interference; (b) turbidity+COD interference
    Selection of characteristic wavelength. (a) COD; (b) turbidity
    Fig. 5. Selection of characteristic wavelength. (a) COD; (b) turbidity
    Selection of characteristic wavelength of COD and turbidity. (a) 230.4 nm; (b) 249.2 nm; (c) 272.8 nm; (d) 295.3 nm; (e) 347 nm; (f) 374.6 nm
    Fig. 6. Selection of characteristic wavelength of COD and turbidity. (a) 230.4 nm; (b) 249.2 nm; (c) 272.8 nm; (d) 295.3 nm; (e) 347 nm; (f) 374.6 nm
    Three dimensional characteristic point diagram of ultraviolet spectrum
    Fig. 7. Three dimensional characteristic point diagram of ultraviolet spectrum
    Comparison of coupling interference results. (a) COD+turbidity interference; (b) turbidity+COD interference
    Fig. 8. Comparison of coupling interference results. (a) COD+turbidity interference; (b) turbidity+COD interference
    Comparison of coupling analytical prediction results. (a) COD; (b) turbidity
    Fig. 9. Comparison of coupling analytical prediction results. (a) COD; (b) turbidity
    SampleCOD /mg·L-1Turbidity /NTUAbsorbance
    λ230.4λ249.2λ272.8λ295.3λ374.6
    1500.4150.1470.0690.0200.001
    2050.1200.0920.0890.0760.003
    3550.4000.2110.1390.0900.004
    108125502.1082.0471.3840.7100.252
    109150502.1222.1591.5030.7480.265
    110150602.1572.3941.7120.7630.384
    Table 1. UV spectral characteristic dataset
    SampleCOD /(mg·L-1Prediction error COD /%Turbidity /NTUPrediction error Turbidity /%
    True valuePredicted valueTrue valuePredicted value
    19.609.461.460.400.392.50
    217.5017.721.263.003.051.60
    310.6010.243.400.400.412.50
    416.4016.420.120.500.514.00
    525.3024.841.8212.0011.791.75
    68.508.621.416.306.421.90
    721.3021.330.1421.2020.871.56
    872.8071.971.1434.8035.201.15
    943.7044.602.0219.6019.570.15
    Table 2. Verification results of actual water sample model
    Prediction indexR2RMSE /(mg·L-1RSD /%
    COD0.9980.3431.50
    Turbidity0.1252.43
    Table 3. SVR model prediction performance index
    Jiguang Jiang, Lei Shi, Chengzhi Su, Chuan Chang, Xiaotian Li, Xiaolong Hou, Aixin Tian. Decoupled Prediction Method for Water Pollutant Concentration Based on SPA-SVR Using Ultraviolet Spectroscopy[J]. Laser & Optoelectronics Progress, 2023, 60(7): 0730004
    Download Citation