- Spectroscopy and Spectral Analysis
- Vol. 42, Issue 9, 2890 (2022)
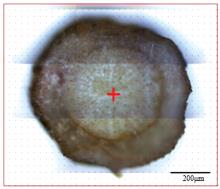
Fig. 1. Microsection of root in apple stock
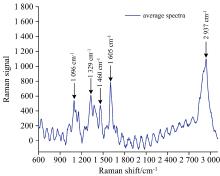
Fig. 2. Raman spectrum average graph
Fig. 3. (a) Mean Raman spectrum; (b) preprocessed image of mean Raman spectrum
Fig. 4. Intensity map of Raman signal in four kinds of band
Fig. 5. Single-band Raman peak imaging at root tissue of apple rootstock
Fig. 6. (a) SVM Optimization parameters; (b) SVM model
|
Table 1. The main parameters of Raman spectrometer for collecting spectral data
|
Table 2. PLS-DA discriminant result confusion matrix

Download Citation


Set citation alerts for the article
Please enter your email address

© Copyright 2018-2021 | Chinese Laser Press. All Rights Reserved 沪ICP备15018463号-20