
Jun Meng, Ximeng Zhao. Human Body Recognition and Positioning with Multiple Cameras Based on “Vibration Signals” from Skin Surfaces[J]. Acta Optica Sinica, 2019, 39(5): 0515001
- Acta Optica Sinica
- Vol. 39, Issue 5, 0515001 (2019)
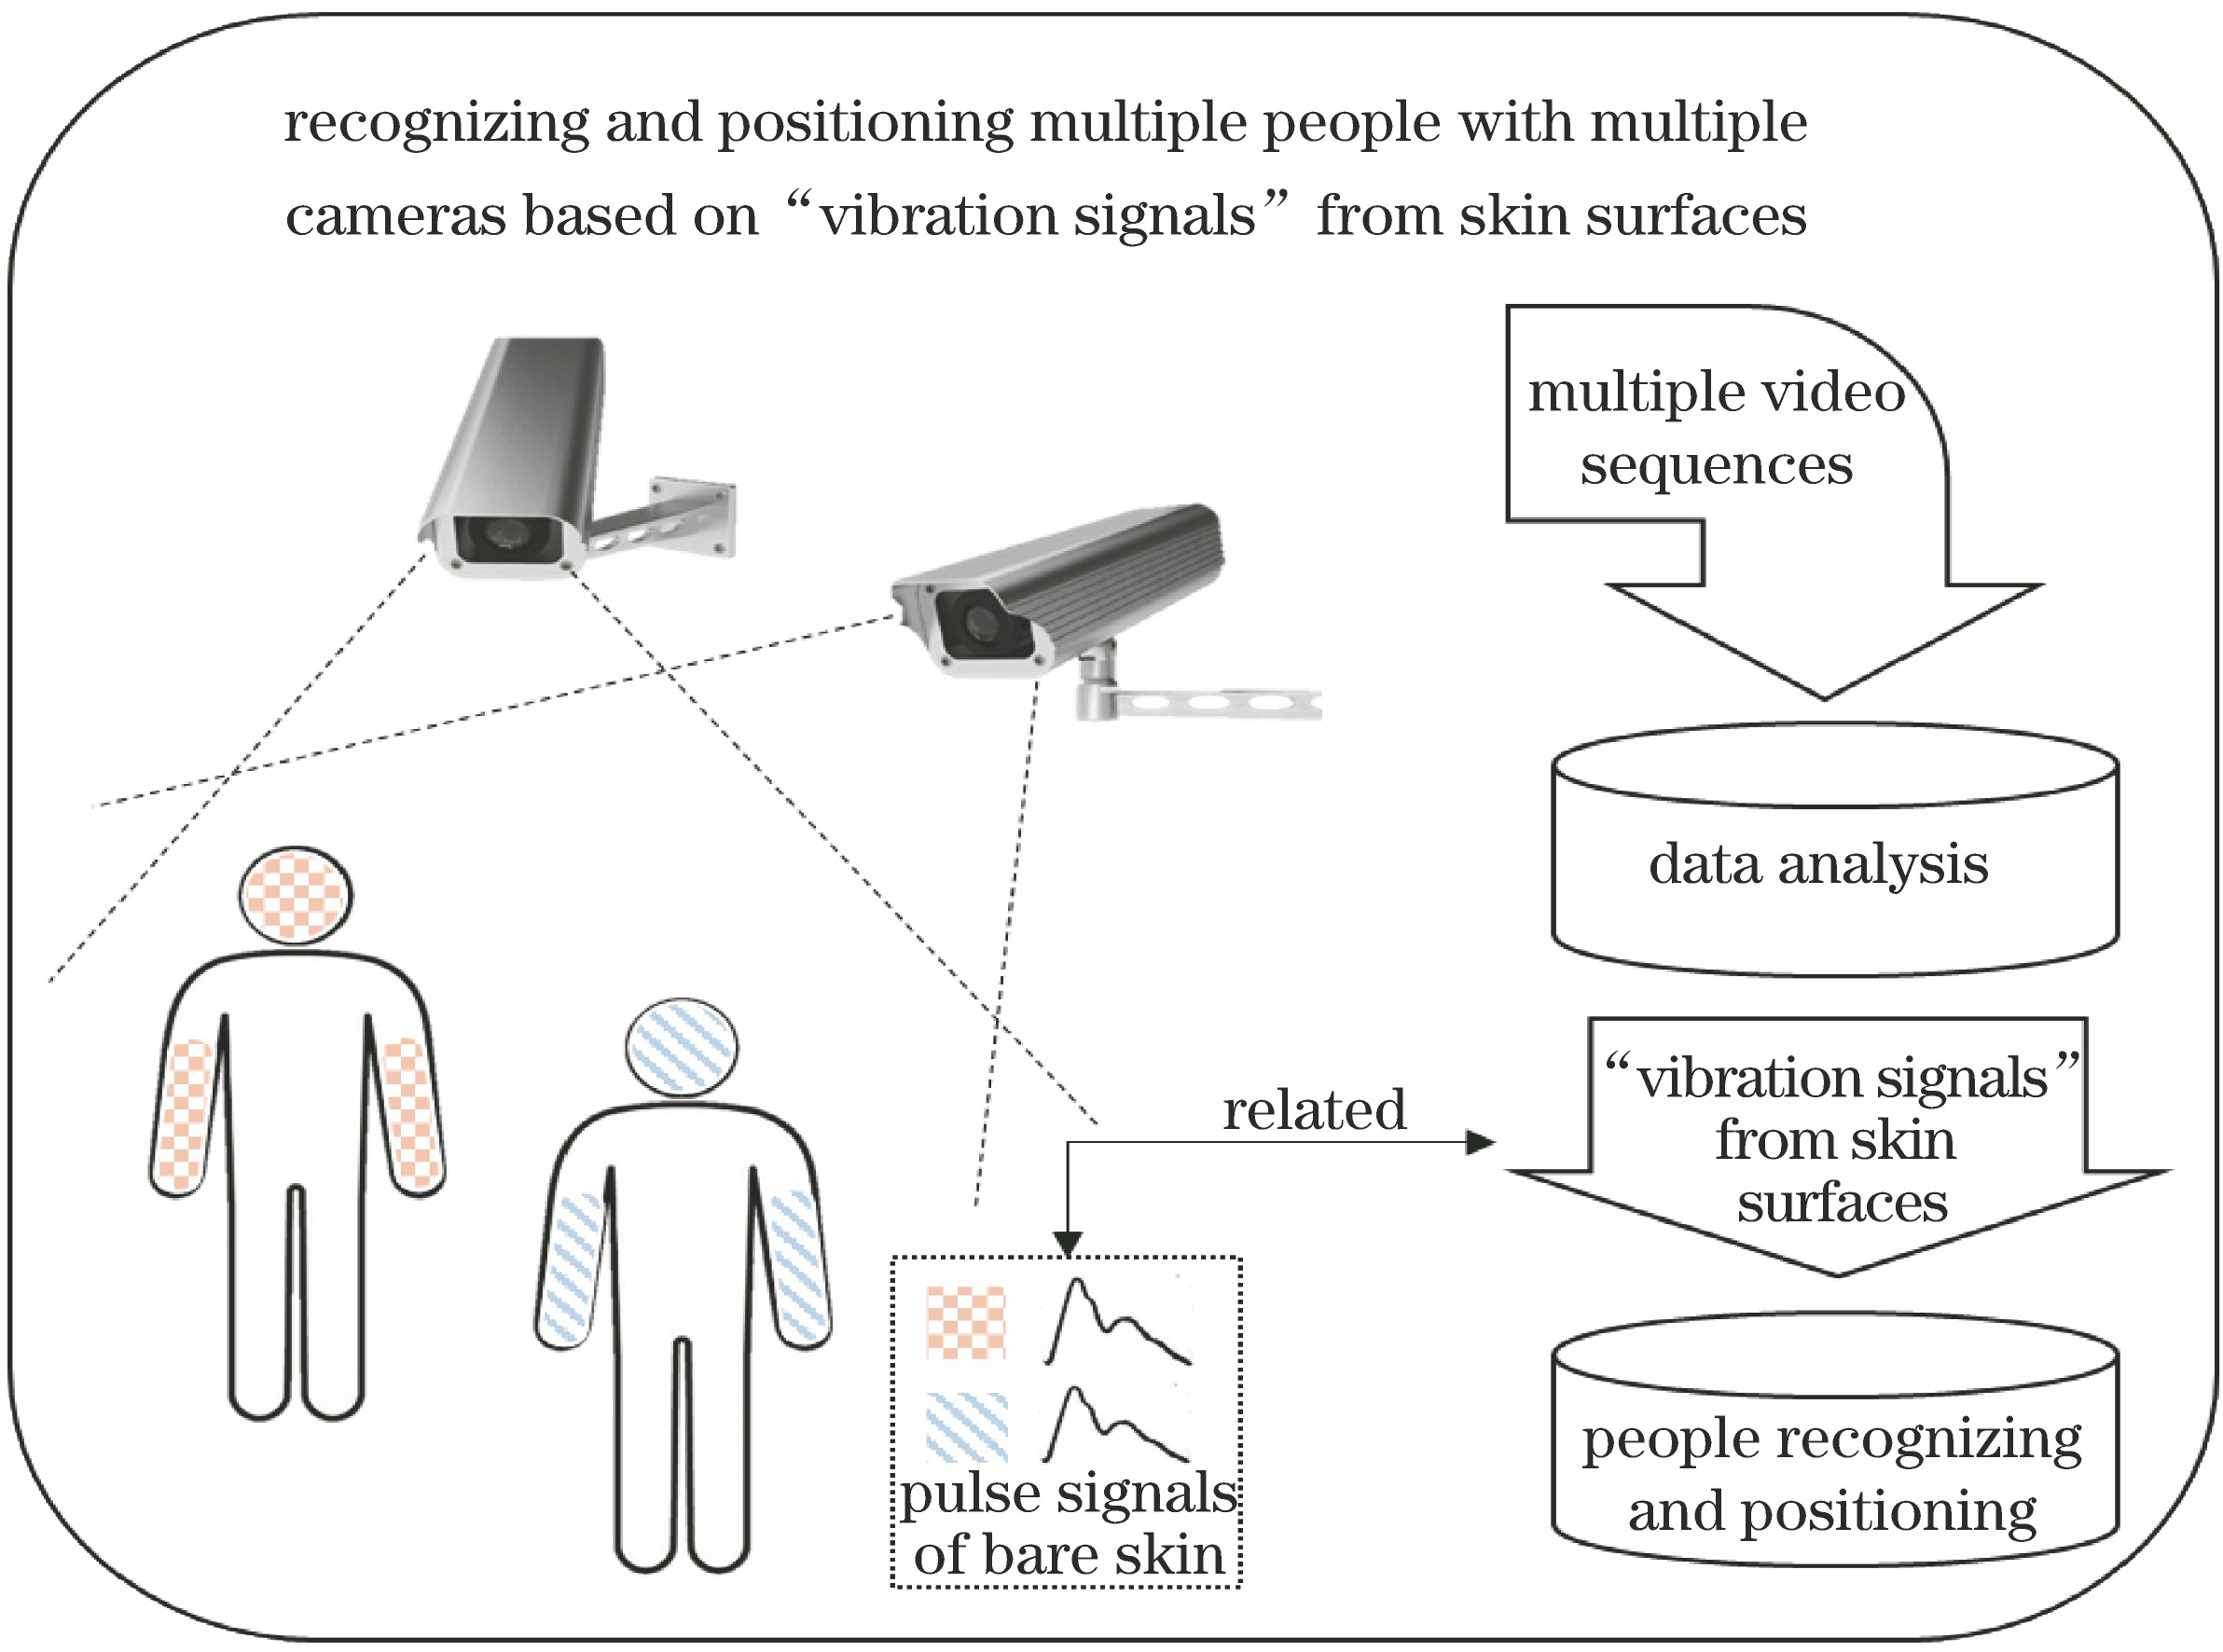
Fig. 1. Illustration of multiple people recognition and positioning with multiple cameras based on “vibration signals” from skin surfaces
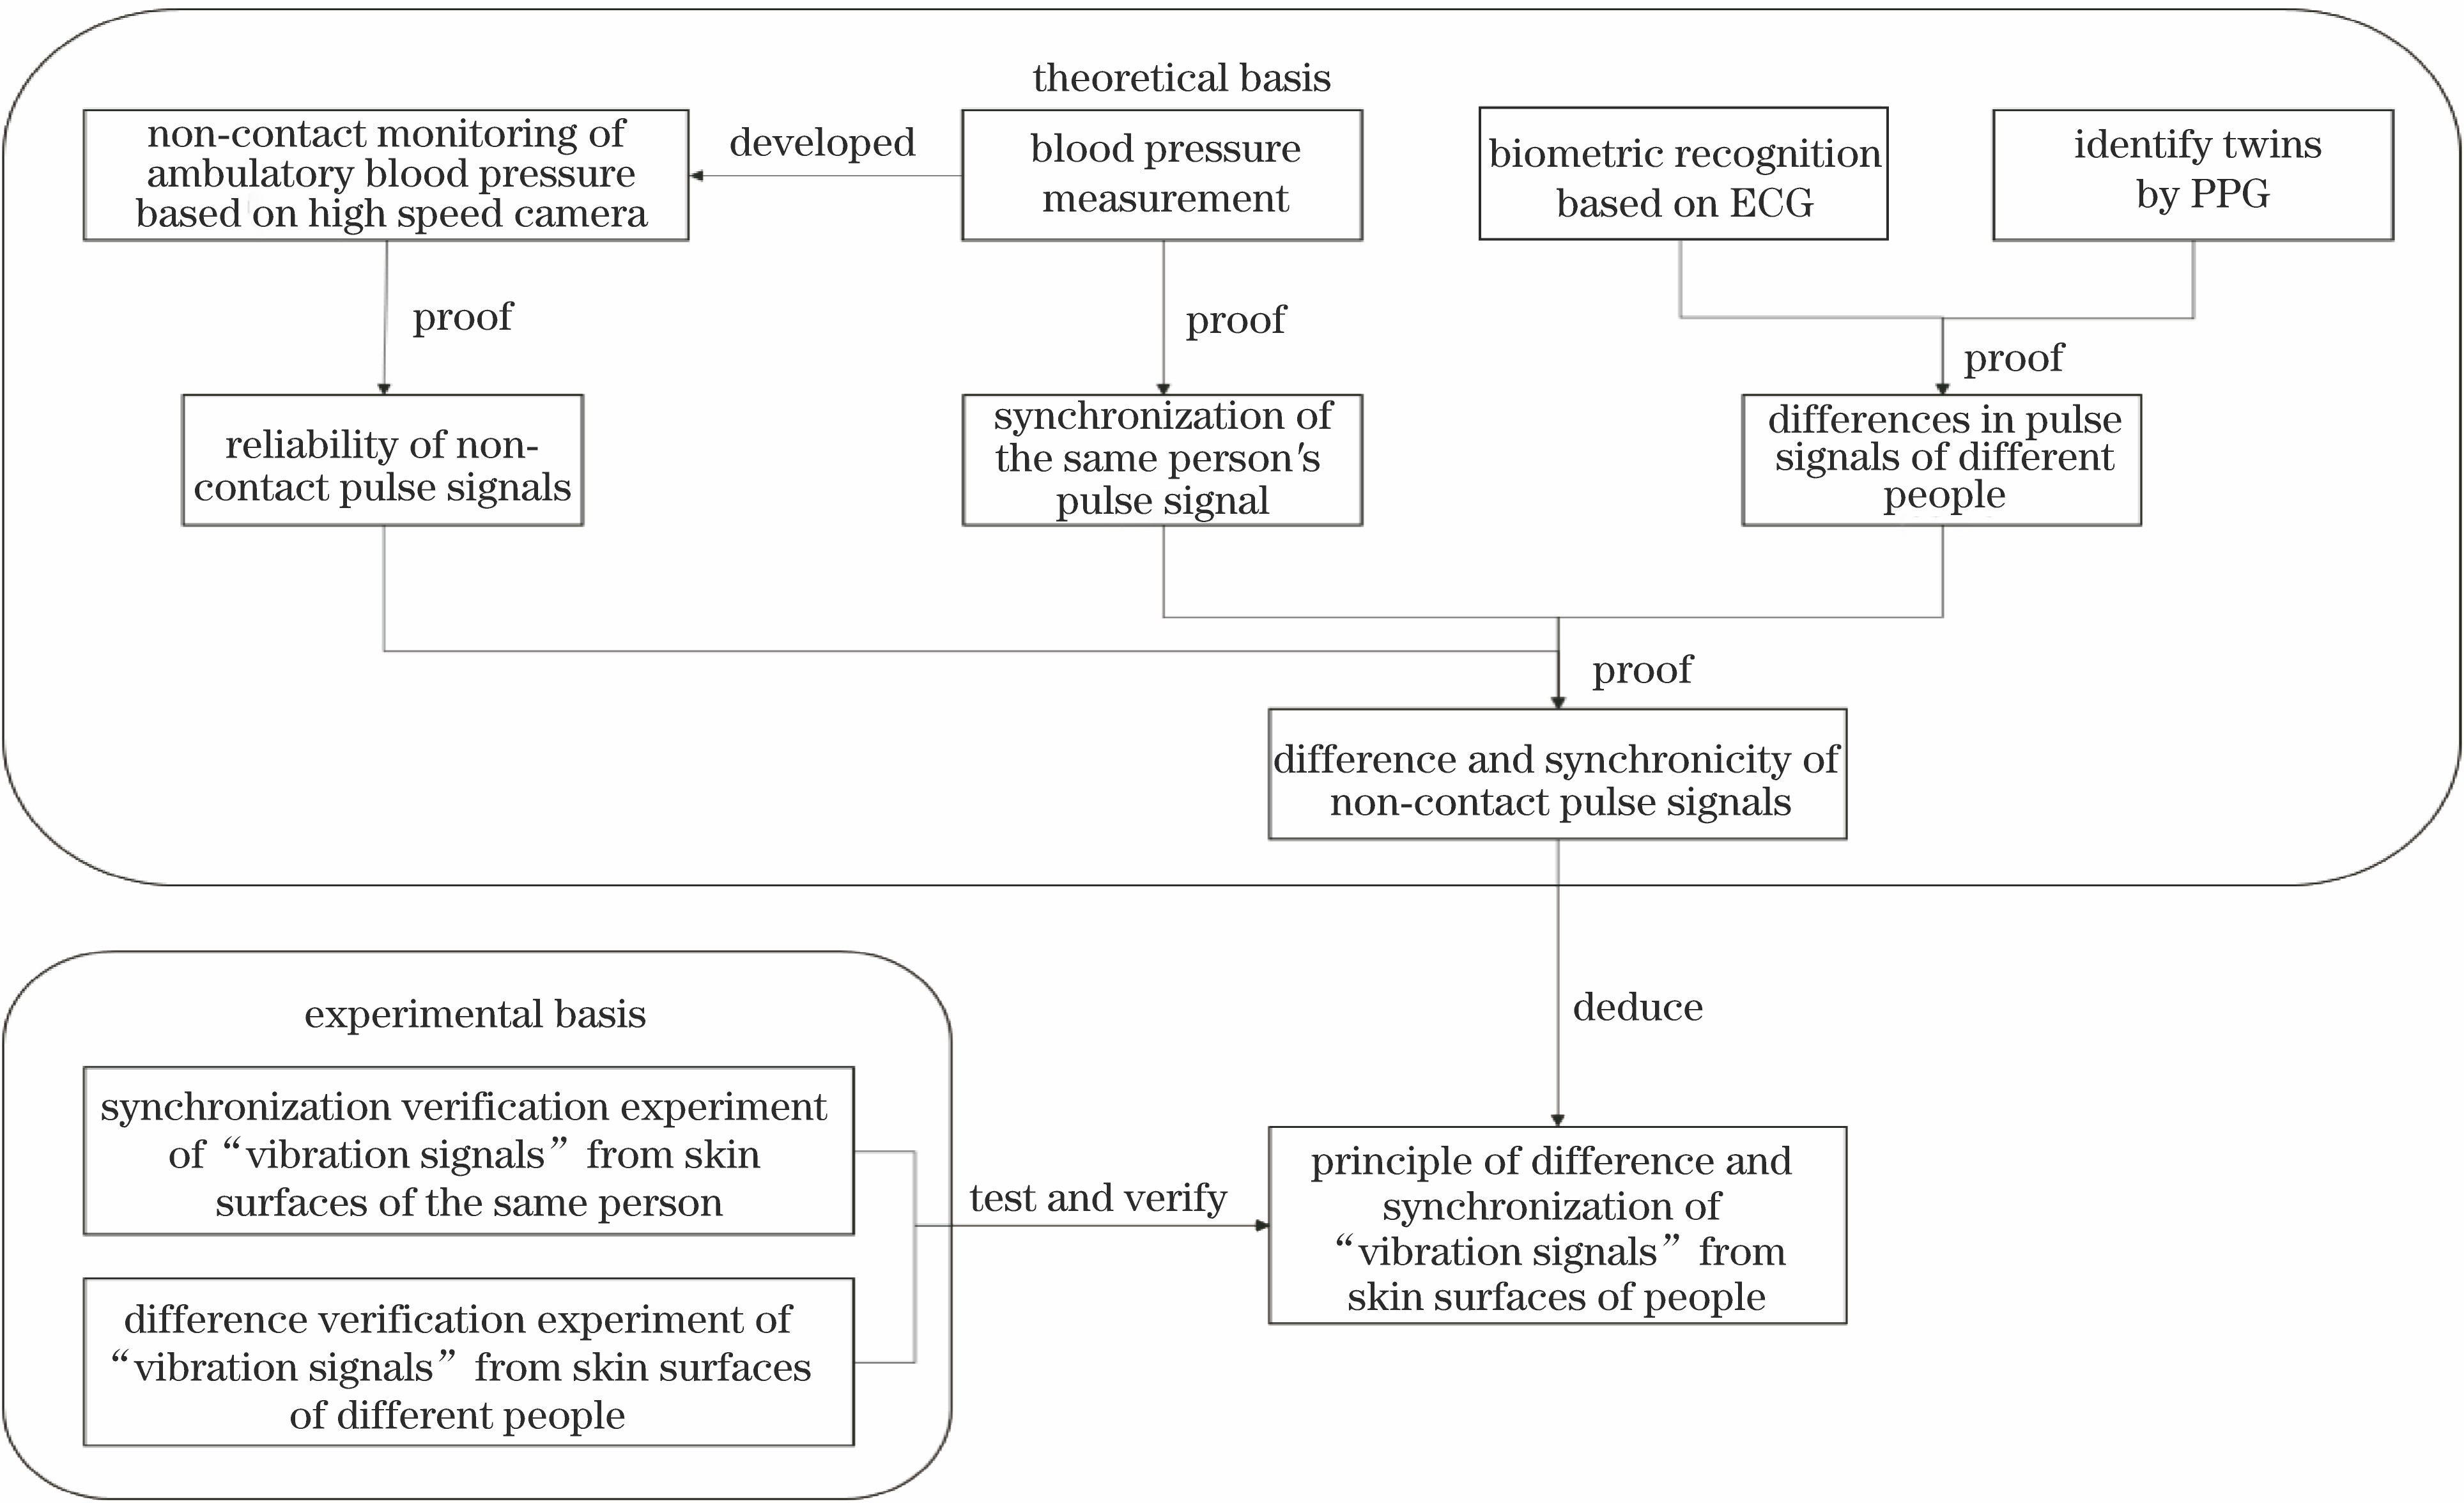
Fig. 2. Principle derivation of difference and synchronization of “vibration signals” from skin surfaces
Fig. 3. Validation of synchronization and difference. (a) Experimental scene 1; (b) experimental scene 2; (c) example of IPPG signal acquisition for different skin areas of the same object under the same camera; (d) IPPG signal acquisition for different skin areas of different objects under the same camera
Fig. 4. IPPG signal acquisition for the same skin area of different objects under multiple cameras
Fig. 5. Flow chart of human body recognition and positioning system based on multiple cameras
Fig. 6. Acquisition of “vibration signals” from human skin surfaces
Fig. 7. Positioning with three cameras. (a) Top view of experimental scene; (b) principle diagram of positioning
Fig. 8. One frame of acquired video with three cameras and tracked skin areas
Fig. 9. IPPG signals acquired by camera 3
Fig. 10. IPPG signals acquired by cameras 2 and 3
Fig. 11. Multiple coordinate calculation results of objects A and B
Fig. 12. Experimental scene of 5 objects for recognition and positioning with 3 cameras. (a) Experimental scene for multi-object recognition and positioning; (b) top view of scene; (c) one frame of acquired video by three cameras and skin areas
Fig. 13. Schematic of accuracy area distribution of camera
Fig. 14. Coordinate calculation results of 5 objects
|
Table 1. Method comparison for multiple people recognition and positioning with multiple cameras
|
Table 2. Similarity of IPPG signals acquired by camera 3
|
Table 3. Similarity of IPPG signals acquired by cameras 2 and 3
|
Table 4. Classification results of similarity comparison and normalization
|
Table 5. Precision and recall rates of classification results of similarity comparison and normalization

Set citation alerts for the article
Please enter your email address
© Copyright 2018-2021 | Chinese Laser Press. All Rights Reserved 沪ICP备15018463号-20