• Chinese Optics Letters
  • Vol. 15, Issue 1, 011404 (2017)
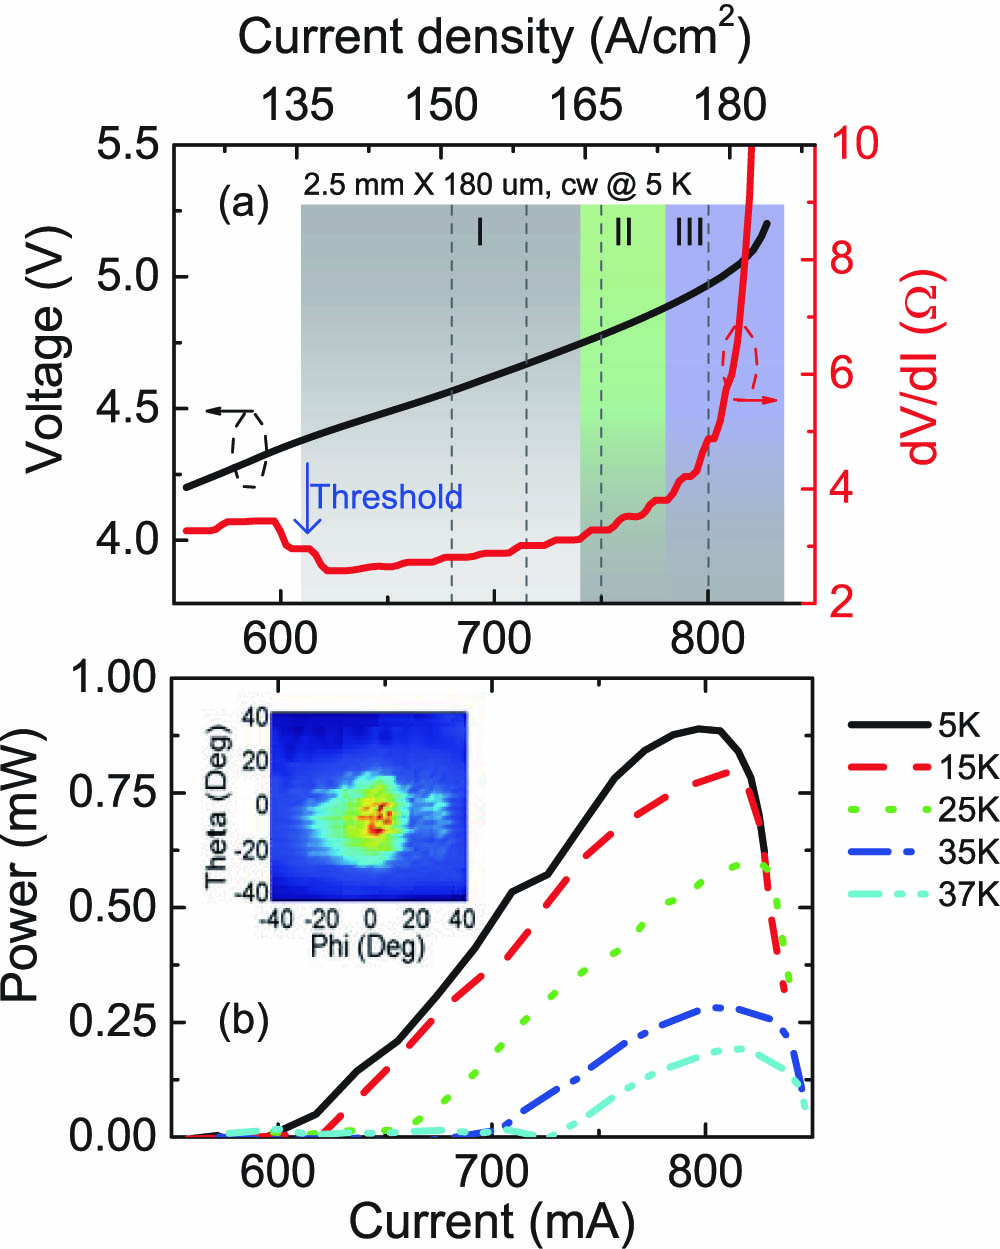
Yonghao Zhu1, Hua Li1、*, Wenjian Wan1, Li Gu1, Tao Zhou1, Stefano Barbieri2, and Juncheng Cao1、3
Author Affiliations
  • 1Key Laboratory of Terahertz Solid State Technology, Shanghai Institute of Microsystem and Information Technology, Chinese Academy of Sciences, Shanghai 200050, China
  • 2Laboratoire Matériaux et Phénomènes Quantiques, Université Paris Diderot and CNRS, UMR 7162, 10 rue A. Domont et L. Duquet, Paris 75205, France
  • 3e-mail: jccao@mail.sim.ac.cn
  • show less
    DOI: 10.3788/COL201715.011404 Cite this Article Set citation alerts
    Yonghao Zhu, Hua Li, Wenjian Wan, Li Gu, Tao Zhou, Stefano Barbieri, Juncheng Cao. Beat note analysis and spectral modulation of terahertz quantum cascade lasers with radio frequency injection[J]. Chinese Optics Letters, 2017, 15(1): 011404 Copy Citation Text show less
    (a) Measured voltage-current (V−I) (left axis) and the first-order derivative of the V−I curve (right axis) of the terahertz QCL in cw mode at 5 K. The laser is 2.5 mm long and 180 μm wide. The gray, green, and purple shaded areas denote the different current regimes I, II, and III, respectively. The dashed vertical lines indicate the current points (680, 715, 750, and 800 mA) that are investigated in the following analysis. (b) Light-current (L−I) characteristics of the cw laser at different heat sink temperatures. The power shown in the figure is the collected power without any corrections of water absorption, window transmission, and so on. The inset shows the measured far field beam pattern of the device at 730 mA in pulsed mode with a repetition rate of 10 kHz and a pulse width of 10 μs.
    Fig. 1. (a) Measured voltage-current (VI) (left axis) and the first-order derivative of the VI curve (right axis) of the terahertz QCL in cw mode at 5 K. The laser is 2.5 mm long and 180 μm wide. The gray, green, and purple shaded areas denote the different current regimes I, II, and III, respectively. The dashed vertical lines indicate the current points (680, 715, 750, and 800 mA) that are investigated in the following analysis. (b) Light-current (LI) characteristics of the cw laser at different heat sink temperatures. The power shown in the figure is the collected power without any corrections of water absorption, window transmission, and so on. The inset shows the measured far field beam pattern of the device at 730 mA in pulsed mode with a repetition rate of 10 kHz and a pulse width of 10 μs.
    (a) Free running beat note mapping of the terahertz QCL as a function of drive current measured at 10 K in cw mode. (b) Single-shot beat note spectra recorded at 715 (black curve) and 750 mA (red curve) when free running. The arrows show the 3 dB linewidths of the free running beat note spectra. The resolution bandwidth is set as 300 kHz. (c) The beat note spectra measured with the “Max-Hold” function of the spectrum analyzer at 715 (black curve) and 750 mA (red curve) in a time duration of 3 min. Note that the center frequencies are subtracted for clarity.
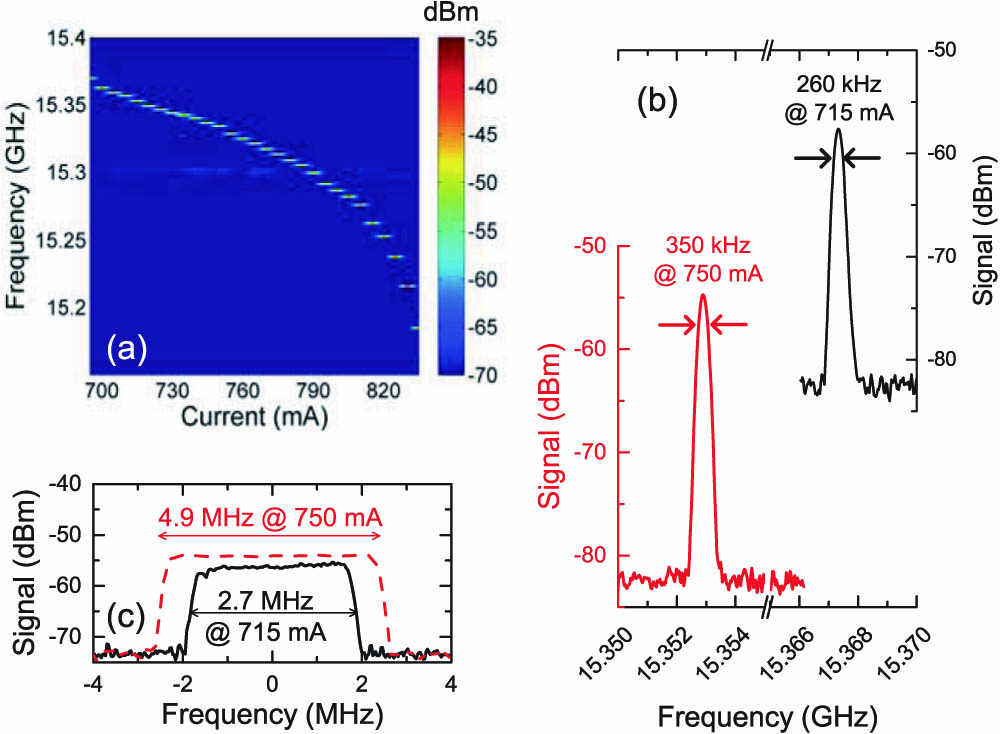
    Fig. 2. (a) Free running beat note mapping of the terahertz QCL as a function of drive current measured at 10 K in cw mode. (b) Single-shot beat note spectra recorded at 715 (black curve) and 750 mA (red curve) when free running. The arrows show the 3 dB linewidths of the free running beat note spectra. The resolution bandwidth is set as 300 kHz. (c) The beat note spectra measured with the “Max-Hold” function of the spectrum analyzer at 715 (black curve) and 750 mA (red curve) in a time duration of 3 min. Note that the center frequencies are subtracted for clarity.
    Rectified voltage signal of the terahertz QCL measured at different drive currents of (a) 680, (b) 750, and (c) 800 mA at 10 K. The RF power is set to a constant of 5 dBm. The vertical gray dashed line indicates the beat note frequency range of the terahetz QCL when free running. The horizontal dashed lines denote the 3 dB level for each case. The modulation bandwidths by neglecting the broad dip around 6 GHz are also shown for each case.
    Fig. 3. Rectified voltage signal of the terahertz QCL measured at different drive currents of (a) 680, (b) 750, and (c) 800 mA at 10 K. The RF power is set to a constant of 5 dBm. The vertical gray dashed line indicates the beat note frequency range of the terahetz QCL when free running. The horizontal dashed lines denote the 3 dB level for each case. The modulation bandwidths by neglecting the broad dip around 6 GHz are also shown for each case.
    (a) Beat note spectra of the terahertz QCL under the RF injection by sweeping the RF frequency along the gray dashed line from 15.36 to 15.38 GHz. The RF power is set to a constant of 10 dBm. The blue dashed line shows the shift trace of the pulled beat note. (b) The beat note spectra under the RF injection by increasing the RF power from 0 to 18 dBm. The RF frequency is fixed at 15.366 GHz. The vertical offsets are added in each curve to show the pulling effect under the RF injection. All the traces are measured at the drive current of 715 mA at the heat sink temperature of 10 K.
    Fig. 4. (a) Beat note spectra of the terahertz QCL under the RF injection by sweeping the RF frequency along the gray dashed line from 15.36 to 15.38 GHz. The RF power is set to a constant of 10 dBm. The blue dashed line shows the shift trace of the pulled beat note. (b) The beat note spectra under the RF injection by increasing the RF power from 0 to 18 dBm. The RF frequency is fixed at 15.366 GHz. The vertical offsets are added in each curve to show the pulling effect under the RF injection. All the traces are measured at the drive current of 715 mA at the heat sink temperature of 10 K.
    Left column: terahertz emission spectra measured with (a) RF off and different RF powers of (b) 0, (c) 10, (d) 20, and (e) 25 dBm. The RF frequency is fixed at 15.37 GHz. Right column: terahertz emission spectra at different RF frequencies spanning around the free running laser beat note frequency ∼15.4 GHz. The measurement was performed at the drive current of 680 mA at 10 K.
    Fig. 5. Left column: terahertz emission spectra measured with (a) RF off and different RF powers of (b) 0, (c) 10, (d) 20, and (e) 25 dBm. The RF frequency is fixed at 15.37 GHz. Right column: terahertz emission spectra at different RF frequencies spanning around the free running laser beat note frequency 15.4GHz. The measurement was performed at the drive current of 680 mA at 10 K.
    Yonghao Zhu, Hua Li, Wenjian Wan, Li Gu, Tao Zhou, Stefano Barbieri, Juncheng Cao. Beat note analysis and spectral modulation of terahertz quantum cascade lasers with radio frequency injection[J]. Chinese Optics Letters, 2017, 15(1): 011404
    Download Citation