Abstract
We demonstrate the electrical beat note analysis and radio frequency (RF) injection locking of a continuous wave (cw) terahertz quantum cascade laser (QCL) emitting around 3 THz (). In free running the beat note frequency of the QCL shows a shift of with increasing drive current. The beat note, modulation response, injection pulling, and terahertz emission spectral characteristics in the different current regimes I, II, and III are investigated. The results show that in the current regime I close to the laser threshold we obtain a narrower beat note and flat response to the RF modulation at the cavity round trip frequency. The pulling effect and spectral modulation measurements verify that in the current regime I the RF injection locking is more efficient and a robust tool to modulate the mode number and mode frequency of terahertz QCLs.Frequency mode locking has been extensively observed in lasers[1], spin-transfer torque oscillators[2], matter waves of a Bose gas[3], newly reported central nervous systems[4], and so on. For optical lasers, mode locking is an useful technique to produce a narrow optical pulse and high frequency stability for spectroscopic applications. The pioneering work of active injection locking was reported in 1960s by injecting the beam of the first laser directly into the cavity of the second one[1]. Due to injection locking, we are allowed to investigate the coherence of lasers[5,6]. Different from the interband diode lasers, quantum cascade lasers (QCLs)[7–9] are unipolar devices based on electron intersubband transitions in the conduction band of multiple quantum well structures. The fast radiative relaxation in QCLs results in a flat modulation frequency response that makes QCLs more suitable for fast modulation[10,11]. For multimode QCLs with a Fabry–Perot cavity geometry, the emission spectrum is inherently modulated due to the resonant cavity. In the multimode operation regime, the beat note frequency from the beating between two adjacent longitudinal modes is equal to the cavity round trip frequency determined by the cavity length. Because of this, one can easily do injection locking by injecting the radio frequency (RF) signal at the cavity round trip frequency. It has already been verified that QCLs emitting in mid-infrared and terahertz wavelength ranges can be modulated and injection locked up to dozens of gigahertz[12–15]. The injection locking technique plays an important role in the phase locking[16,17] and broadband frequency comb operation[18,19] of terahertz QCLs.
In this Letter, we demonstrate the beat note analysis and spectral modulation of a 2.5 mm long and 180 μm wide terahertz QCL with a bound-to-continuum (BTC) active region structure. The beat note, modulation response, injection pulling, and terahertz emission spectral modulation in different current regimes are investigated. In the current regime that is close to the laser threshold, we clearly observe the pulling effect and the strongly modulated terahertz emission lines under RF injection locking.
The BTC active region of the terahertz QCL is similar to that in Ref. [20]. The As/GaAs active region was grown by using a gas source molecular beam epitaxy (MBE) system on a lattice-matched semi-insulating GaAs (100) substrate. After the MBE growth, the wafer was processed into single plasmon waveguide devices. Finally, the processed sample was cleaved and mounted on a cooper cold finger of a continuous flow liquid helium cryostat for electrical and optical measurements.
To facilitate the beat note and RF injection measurements, the cryostat was wired using semi-rigid coax cable and flexible microwave cable with a bandwidth up to 18 GHz. A transmission line was used to accomplish the impedance match between the RF cable and the terahertz QCL chip[12]. The electrical beat note was measured using a Bias-Tee. Before we sent the beat note signal into the spectrum analyzer, a RF amplifier with a gain of 30 dB was installed to improve the signal-to-noise ratio. A RF generator with a frequency up to 26 GHz with a maximum power of 25 dBm was used to inject an RF signal into the THz QCL. The beat note and RF injection setup is similar as the one depicted in Refs. [11,13].
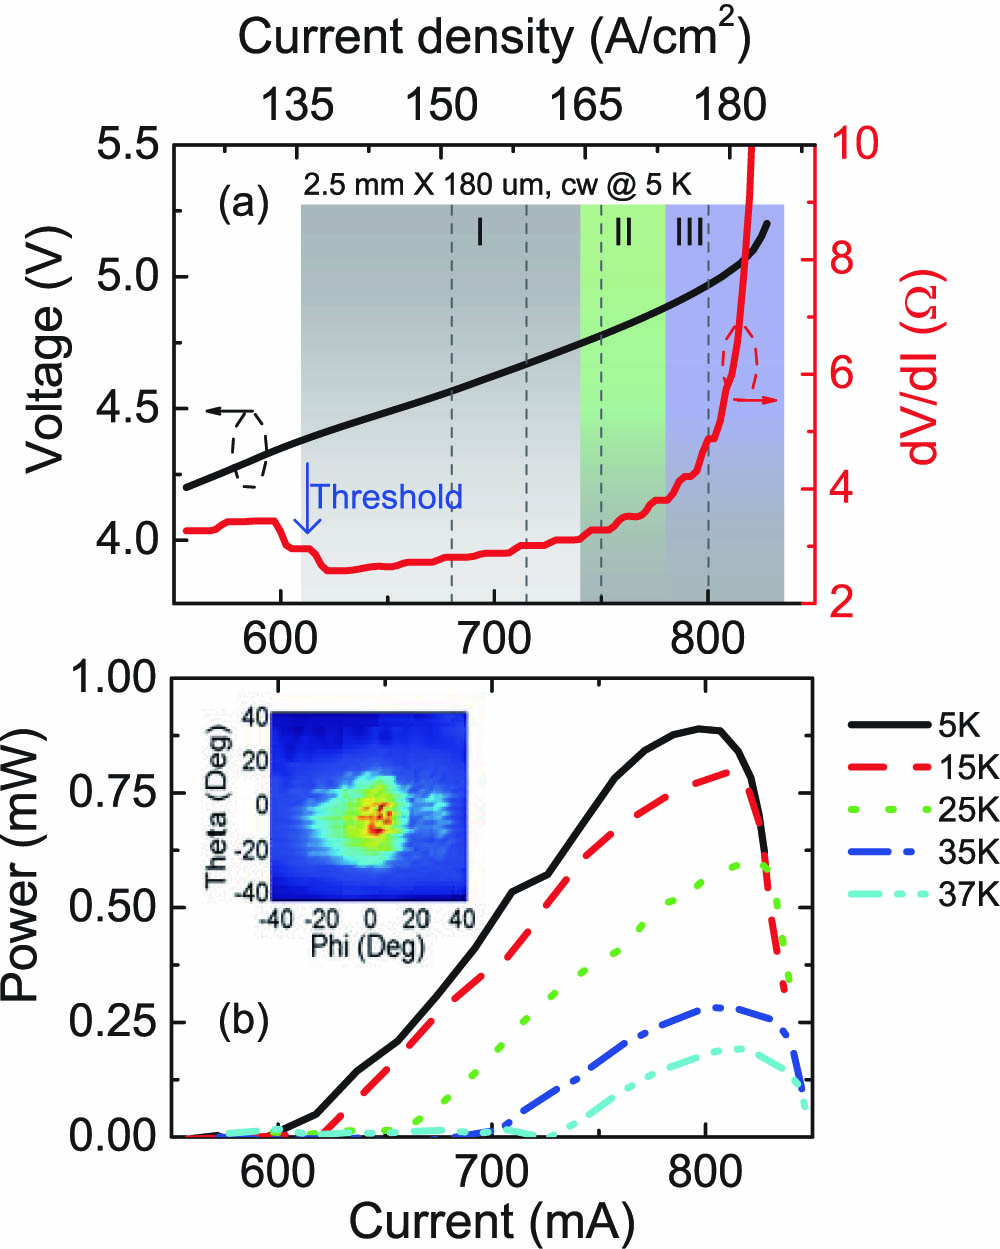
Figure 1(a) shows the curve measured in continuous wave (cw) mode at 5 K. From the first-order derivative (right axis, red color) of the curve, we can clearly see a “step” around 600 mA, which indicates the threshold of the laser. In Fig. 1(a) we intentionally separate the whole current range into 3 regimes labeled as I (gray), II (green), and III (purple). Regime I is close to the laser threshold, regime III is near the negative differential resistance (NDR), and regime II is the current range located between regimes I and III. The dashed lines in Fig. 1(a) denote the typical current points (680, 715, 750, and 800 mA) in the regimes I, II, and III. The beat note, modulation response, RF injection locking, and terahertz emission spectra at these current points can almost represent the behavior in the three different current regimes. Therefore, in the following work, we will focus our analysis on the results measured at these current points. The cw characteristics are shown in Fig. 1(b). In cw the laser is working up to 37 K. At 5 K, we obtain the maximum power of . In the inset of Fig. 1(b), we show the far field beam pattern of the QCL device measured by rotating a Golay cell detector on a spherical surface with a distance of 10 cm away from the laser facet. The measured beam pattern shows a quasi-Gaussion distribution along both the phi and theta directions. The measured divergences along the phi and theta directions are around 25° and 30°, respectively. It can be noted that the far field pattern could be very similar in the entire current dynamic range as long as the higher-order transverse mode does not appear.

Figure 1.(a) Measured voltage-current () (left axis) and the first-order derivative of the curve (right axis) of the terahertz QCL in cw mode at 5 K. The laser is 2.5 mm long and 180 μm wide. The gray, green, and purple shaded areas denote the different current regimes I, II, and III, respectively. The dashed vertical lines indicate the current points (680, 715, 750, and 800 mA) that are investigated in the following analysis. (b) Light-current () characteristics of the cw laser at different heat sink temperatures. The power shown in the figure is the collected power without any corrections of water absorption, window transmission, and so on. The inset shows the measured far field beam pattern of the device at 730 mA in pulsed mode with a repetition rate of 10 kHz and a pulse width of 10 μs.
The beat note mapping as a function of drive current is shown in Fig. 2(a). In this measurement, the “DC” port of the Bias-Tee is used to apply voltage onto the terahertz QCL and the “RF” port is connected to an amplifier with a gain of 30 dB and then to a spectrum analyzer for the electrical beat note measurement. As shown in Fig. 2(a), the beat note always shows a single frequency line and we can see a red shift of the frequency from 15.374 to 15.197 GHz with an increase in the drive current. In the lower current range (regimes I and II), the beat note frequency shows a linear dependence on current. However, in the high current range (regime III) near the NDR, a strong frequency shift can be observed. This is probably due to the electrical instability of the laser in the NDR region. In Fig. 2(b), we plot the single-shot beat note spectra measured at 715 mA (black) in regime I and 750 mA (red) in regime II. The measured 3 dB linewidths for the cases of 715 and 750 mA are 260 and 350 kHz, respectively. The beat note linewidth measured in regime III (not shown here) can reach the MHz level, which is much broader than those in regimes I and II. On the other hand, to show the frequency drift with time, we use the “Max-Hold” function of the spectrum analyzer and plot the beat note spectra for a time duration of 3 min at 715 (black) and 750 mA (red) in Fig. 2(c). For a clear comparison, the center frequencies of 15.37127455 GHz for 715 mA and 15.35087555 GHz for 750 mA are subtracted. With an increase of the drive current, we can see that the frequency drift increases from 2.7 to 4.9 MHz. Note that the frequency drift can be affected by the environmental vibrations caused by the optical table, cooling, pump, and so on, besides the intrinsic frequency instability of the laser. In this measurement, to avoid the environmental noise, we removed the pump and set the helium flux as small as possible. The spectral broadness with increasing current shows a good agreement with the measurement in Fig. 2(b).
Figure 2.(a) Free running beat note mapping of the terahertz QCL as a function of drive current measured at 10 K in cw mode. (b) Single-shot beat note spectra recorded at 715 (black curve) and 750 mA (red curve) when free running. The arrows show the 3 dB linewidths of the free running beat note spectra. The resolution bandwidth is set as 300 kHz. (c) The beat note spectra measured with the “Max-Hold” function of the spectrum analyzer at 715 (black curve) and 750 mA (red curve) in a time duration of 3 min. Note that the center frequencies are subtracted for clarity.
In the following, we are about to investigate the modulation response, RF injection locking, and terahertz emission modulation in the different current regimes, as shown in Fig. 1(a). The RF injection locking of the round trip frequency is a result of the mutual phase locking of adjacent longitudinal modes of the laser induced by amplitude modulation[13]. Then the injection locking can bring about the strong modulation on the terahertz emission spectra. First of all, to see the modulation response of the terahertz QCL, we perform the rectification measurements as shown in Fig. 3 at different current points. The RF signal with a constant power of 5 dBm is amplitude modulated at a frequency of 1 kHz and then sent to the laser using a Bias-Tee. The rectified voltage signal is read with a lock-in amplifier with a low pass filter (from DC to 2 MHz).
Figure 3.Rectified voltage signal of the terahertz QCL measured at different drive currents of (a) 680, (b) 750, and (c) 800 mA at 10 K. The RF power is set to a constant of 5 dBm. The vertical gray dashed line indicates the beat note frequency range of the terahetz QCL when free running. The horizontal dashed lines denote the 3 dB level for each case. The modulation bandwidths by neglecting the broad dip around 6 GHz are also shown for each case.
Figures 3(a), 3(b), and 3(c) show the modulation response measured at 680 (regime I), 750 (regime II), and 800 mA (regime III), respectively. In all three curves we can see a broad “dip” around 6 GHz. Note that the modulation responses of intersubband QCLs are free of relaxation peaks, which has already been confirmed by several experiments[11,21]. Therefore, the dip around 6 GHz does not originate from the laser itself. It is due to the impedance mismatching effects among the microwave strip line, the QCL chip, and the wire bonds. By optimizing the high-frequency setup, the “dip” can be pushed to the low frequency range or even removed. The dashed horizontal lines show the 3 dB levels of the modulation responses, which then define the modulation bandwidths of 9.0, 9.15, and 2.4 GHz at 680, 750, and 800 mA, respectively. As the current was as high as 800 mA, we observed a rapid shrinking of the modulation bandwidth. We can see that in the NDR regime the modulation bandwidth shows an instability behavior due to the current or power noise. From current regime I to II, we observe a small increase of the modulation bandwidth, which shows the same trend as the previously published theoretical and experimental results[22,23]. In view of this, we observe a strong RF modulation response and a larger modulation bandwidth when the laser is driven in regimes I and II other than in the NDR region. As the RF frequency is beyond 11 GHz, the modulation response is in chaos for each case. However, around the free running beat note frequency of 15.3 GHz, as indicated by the vertical dashed line, we see a flat response at 680 mA and spike peaks at 750 and 800 mA. This flat modulation response in the current regime I gives rise to the strong pulling and efficient injection locking at the cavity round trip frequency obtained in the following measurements. Further investigations on the microwave transmission (S-parameter) and impedance analysis are required to understand the measured chaotic response behavior at the cavity round trip frequency.
Figure 4 shows the beat note spectra of the terahertz QCL under the RF injection recorded at the drive current of 715 mA (regime I). To see the beat note pulling effect, we have to make the laser operate in the multimode regime and show the free running beat note line. At 680 mA the laser is working in single longitudinal mode [see Fig. 5(a)] and therefore no beat note can be detected in free running. So in this measurement we run the laser at the drive current of 715 mA, corresponding to the threshold of the multimode operation of the laser. First, we show in Fig. 4(a) the RF frequency-dependence of the beat note by sweeping the RF frequency from 15.36 to 15.38 GHz with a constant power of 10 dBm. The gray dashed line shows the trace of the sweeping RF frequency and the blue dashed line shows the trace of the pulled beat note. At the bottom of Fig. 4(a), the beat note line at the cavity round trip frequency of 15.373 GHz without RF modulation is shown as a reference. When we sweep the RF frequency from the left to right side of the free running beat note frequency, we see that the beat note is pulled close to the RF peak (15.369 GHz), then injection locked (15.371 GHz), and finally unlocked (15.382 GHz). In the pulling process, we can clearly see the generation of sidebands. At 15.366 GHz, we see one sideband generated on the right side of the pulled beat note; and at 15.369 GHz, we see two sidebands on the right side of the pulled beat note. This is a sign of a strong interaction between the external RF signal and the beat note of the QCL. The spacing of the sidebands indicated by the red arrows in Fig. 4(a) is equal to the difference between the RF frequency and the pulled beat note frequency. It is interesting to see that the sidebands only appear on one side of the external RF frequency. The reason for this asymmetry should be addressed in the future.
Figure 4.(a) Beat note spectra of the terahertz QCL under the RF injection by sweeping the RF frequency along the gray dashed line from 15.36 to 15.38 GHz. The RF power is set to a constant of 10 dBm. The blue dashed line shows the shift trace of the pulled beat note. (b) The beat note spectra under the RF injection by increasing the RF power from 0 to 18 dBm. The RF frequency is fixed at 15.366 GHz. The vertical offsets are added in each curve to show the pulling effect under the RF injection. All the traces are measured at the drive current of 715 mA at the heat sink temperature of 10 K.
In Fig. 4(b), we show the RF power dependence of the beat note. The RF frequency is fixed at 15.366 GHz. As we change the RF power from 0 to 18 dBm, we see again the pulling effect. The dashed line shows the trace of the pulled beat note. At 0 dBm we already observe the sideband generation. With increasing the RF power to 15 dBm, we see more sidebands that indicate the stronger pulling. When the RF power reaches 18 dBm, the beat note is finally injection locked. The two shoulders of the 18 dBm RF signal come electrically from the RF generator. It is worth noting that when the laser is driven at a high current with a small slope efficiency the pulling effect cannot be observed. However, we can see an abrupt injection locking with a large RF power. The RF power required for the injection locking is dependent on the frequency difference between the external RF and the QCL beat note.
The terahertz emission spectra with RF modulation measured at 680 mA at 10 K are shown in Fig. 5. We can clearly see a strong spectral modulation with the RF injection. The RF power- and frequency-dependence of the emission spectra are plotted in the left and right column of Fig. 5, respectively. Without RF modulation, at 680 mA the laser is working in single-longitudinal mode [see Figs. 5(a) and 5(f)]. As we fix the frequency at 15.37 GHz and then increase the RF power from 0 to 25 dBm, we observe multimode operations and an increase in number of the modes from 3 to 5. Once the laser is working in multimode, the mode spacing is locked at the RF frequency of 15.37 GHz. In the right column of Fig. 5 we fix the RF power and change the RF frequency from 15.21 to 15.48 GHz. When the RF frequency is smaller than the free running beat note frequency and out of the locking range [Fig. 5(g)], we see that the terahertz emission is weakly modulated and one sideband on the right of the main peak is generated. On the other hand, when the RF frequency is larger than the beat note frequency and out of the locking range [Fig. 5(i)], the emission spectrum is also weakly modulated. However, the sideband is generated on the left side of the main peak. So, by injecting an RF signal with different frequencies, we are able to weakly modulate the terahertz emission spectra and the position of the sideband. In Fig. 5(h) when the laser is modulated at around the cavity round trip frequency of 15.37 GHz, injection locking is achieved and we observe 5 modes in the spectrum. We also did the emission spectra measurements at high drive currents in the current regimes II and III with RF modulation. However, the emission spectra were almost unchanged with RF modulation at the free running intermode beat note frequency. This weak modulation effect is probably due to the chaotic modulation response around 15.3 GHz when the laser is driven at higher currents, as shown in Fig. 3. As can be seen from the data presented in Fig. 5, RF injection is a robust tool to modulate the mode number and mode frequency of terahertz QCLs driven at the current regime I close to the laser threshold.
Figure 5.Left column: terahertz emission spectra measured with (a) RF off and different RF powers of (b) 0, (c) 10, (d) 20, and (e) 25 dBm. The RF frequency is fixed at 15.37 GHz. Right column: terahertz emission spectra at different RF frequencies spanning around the free running laser beat note frequency . The measurement was performed at the drive current of 680 mA at 10 K.
In conclusion, we systematically investigate the beat note, modulation response, pulling effect, and spectral modulation of a BTC terahertz QCL emitting around 3 THz in cw mode in the current regimes I, II, and III. We find that when the current is smaller than the NDR current of 800 mA, the measured modulation bandwidth increases with the current. However, the modulation bandwidth () is still smaller than the laser round trip frequency. In the current regime I that is close to the laser threshold, we observe a flat modulation response at the laser round trip frequency around 15.3 GHz which gives rise to the strong THz spectral modulation under external RF injection. The pulling effect and spectral modulation measurements verify that in the current regime I the RF injection locking is more efficient and it is a robust tool to modulate the mode number and mode frequency of terahertz QCLs. In the future, efficient modulation is proposed to be applied on broadband terahertz QCLs to generate homogeneously broad spectral spanning and then used in fast and high resolution spectroscopic applications. It is worth noting that the technique presented here can be also used for fast optical communication[24] systems.
References
[1] H. L. Stover, W. H. Steier. Appl. Phys. Lett., 8, 91(1966).
[2] S. Kaka, M. R. Pufall, W. H. Rippard, T. J. Silva, S. E. Russek, J. A. Katine. Nature, 437, 389(2005).
[3] S. Hofferberth, I. Lesanovsky, B. Fischer, T. Schumm, J. Schmiedmayer. Nature, 449, 324(2007).
[4] U. Rutishauser, I. B. Ross, A. N. Mamelak, E. M. Schuman. Nature, 464, 903(2010).
[5] J. Reichert, R. Holzwarth, T. Udem, T. W. Hansch. Opt. Commun., 172, 59(1999).
[6] B. Bernhardt, A. Ozawa, P. Jacquet, M. Jacquey, Y. Kobayashi, T. Udem, R. Holzwarth, G. Guelachvili, T. W. Hansch, N. Picque. Nat. Photonics, 4, 55(2010).
[7] J. Faist, F. Capasso, D. L. Sivco, C. Sirtori, A. L. Hutchinson, A. Y. Cho. Science, 264, 553(1994).
[8] S. Kumar. Chin. Opt. Lett., 9, 110003(2011).
[9] L. Gu, Z. Tan, Q. Wu, C. Wang, J. Cao. Chin. Opt. Lett., 13, 081402(2016).
[10] R. Paiella, F. Capasso, C. Gmachl, H. Y. Hwang, D. L. Sivco, A. L. Hutchinson, A. Y. Cho, H. C. Liu. Appl. Phys. Lett., 77, 169(2000).
[11] S. Barbieri, W. Maineult, S. S. Dhillon, C. Sirtori, J. Alton, N. Breuil, H. E. Beere, D. A. Ritchie. Appl. Phys. Lett., 91, 143510(2007).
[12] W. Maineult, L. Ding, P. Gellie, P. Filloux, C. Sirtori, S. Barbieri, T. Akalin, J. F. Lampin, I. Sagnes, H. E. Beere, D. A. Ritchie. Appl. Phys. Lett., 96, 021108(2010).
[13] P. Gellie, S. Barbieri, J. F. Lampin, P. Filloux, C. Manquest, C. Sirtori, I. Sagnes, S. P. Khanna, E. H. Linfield, A. G. Davies, H. Beere, D. Ritchie. Opt. Express, 18, 20799(2010).
[14] A. Calvar, M. I. Amanti, M. R. St-Jean, S. Barbieri, A. Bismuto, E. Gini, M. Beck, J. Faist, C. Sirtori. Appl. Phys. Lett., 102, 181114(2013).
[15] M. R. St-Jean, M. I. Amanti, A. Bernard, A. Calvar, A. Bismuto, E. Gini, M. Beck, J. Faist, H. C. Liu, C. Sirtori. Laser Photonics Rev., 8, 443(2014).
[16] S. Barbieri, P. Gellie, G. Santarelli, L. Ding, W. Maineult, C. Sirtori, R. Colombelli, H. Beere, D. Ritchie. Nat. Photonics, 4, 636(2010).
[17] S. Barbieri, M. Ravaro, P. Gellie, G. Santarelli, C. Manquest, C. Sirtori, S. P. Khanna, E. H. Linfield, A. G. Davies. Nat. Photonics, 5, 306(2011).
[18] M. Rösch, G. Scalari, M. Beck, J. Faist. Nat. Photonics, 9, 42(2015).
[19] H. Li, P. Laffaille, D. Gacemi, M. Apfel, C. Sirtori, J. Leonardon, G. Santarelli, M. Rösch, G. Scalari, M. Beck, J. Faist, W. Hänsel, R. Holzwarth, S. Barbieri. Opt. Express, 23, 33270(2015).
[20] S. Barbieri, J. Alton, H. E. Beere, J. Fowler, E. H. Linfield, D. A. Ritchie. Appl. Phys. Lett., 85, 1674(2004).
[21] F. Capasso, R. Paiella, R. Martini, R. Colombelli, C. Gmachl, T. L. Myers, M. S. Taubman, R. M. Williams, C. G. Bethea, K. Unterrainer, H. Y. Hwang, D. L. Sivco, A. Y. Cho, A. M. Sergent, H. C. Liu, E. A. Whittaker. IEEE J. Quantum Electron., 38, 511(2002).
[22] F. Rana, R. J. Ram. Phys. Rev. B, 65, 125313(2002).
[23] B. Hinkov, A. Hugi, M. Beck, J. Faist. Opt. Express, 24, 3294(2016).
[24] L. Cheng, L. Xi, D. Zhao, X. Tang, W. Zhang, X. Zhang. Chin. Opt. Lett., 13, 100604(2016).