
Rohit Singh, Deepu Koshy George, Chejin Bae, K. A. Niessen, A. G. Markelz. Modulated orientation-sensitive terahertz spectroscopy[J]. Photonics Research, 2016, 4(3): 00A1
- Photonics Research
- Vol. 4, Issue 3, 00A1 (2016)
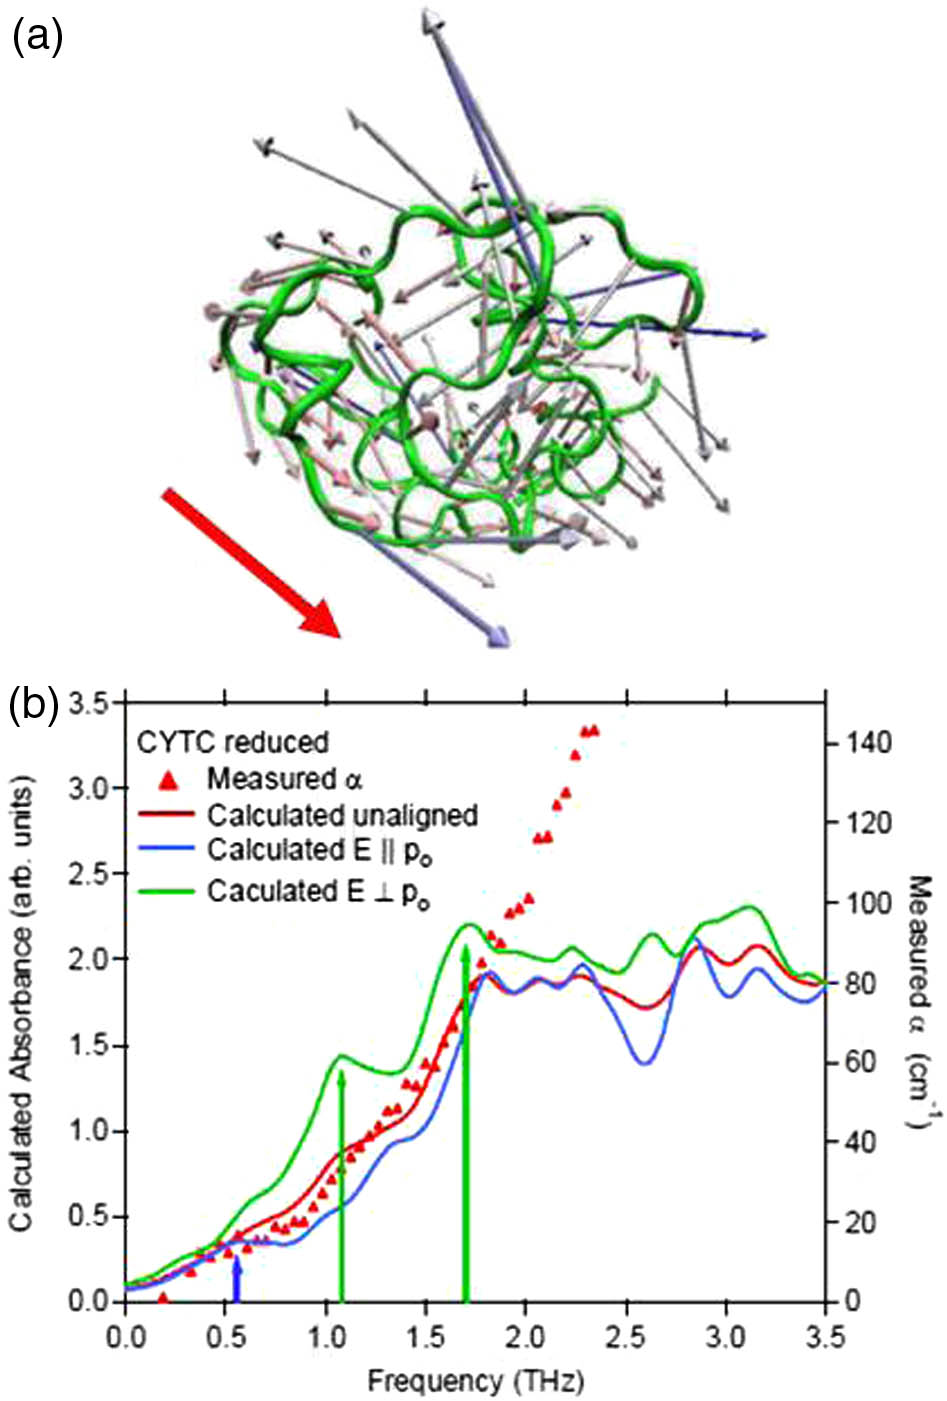
Fig. 1. (a) Displacement vector diagram for intramolecular vibration at 9.72 cm − 1 c
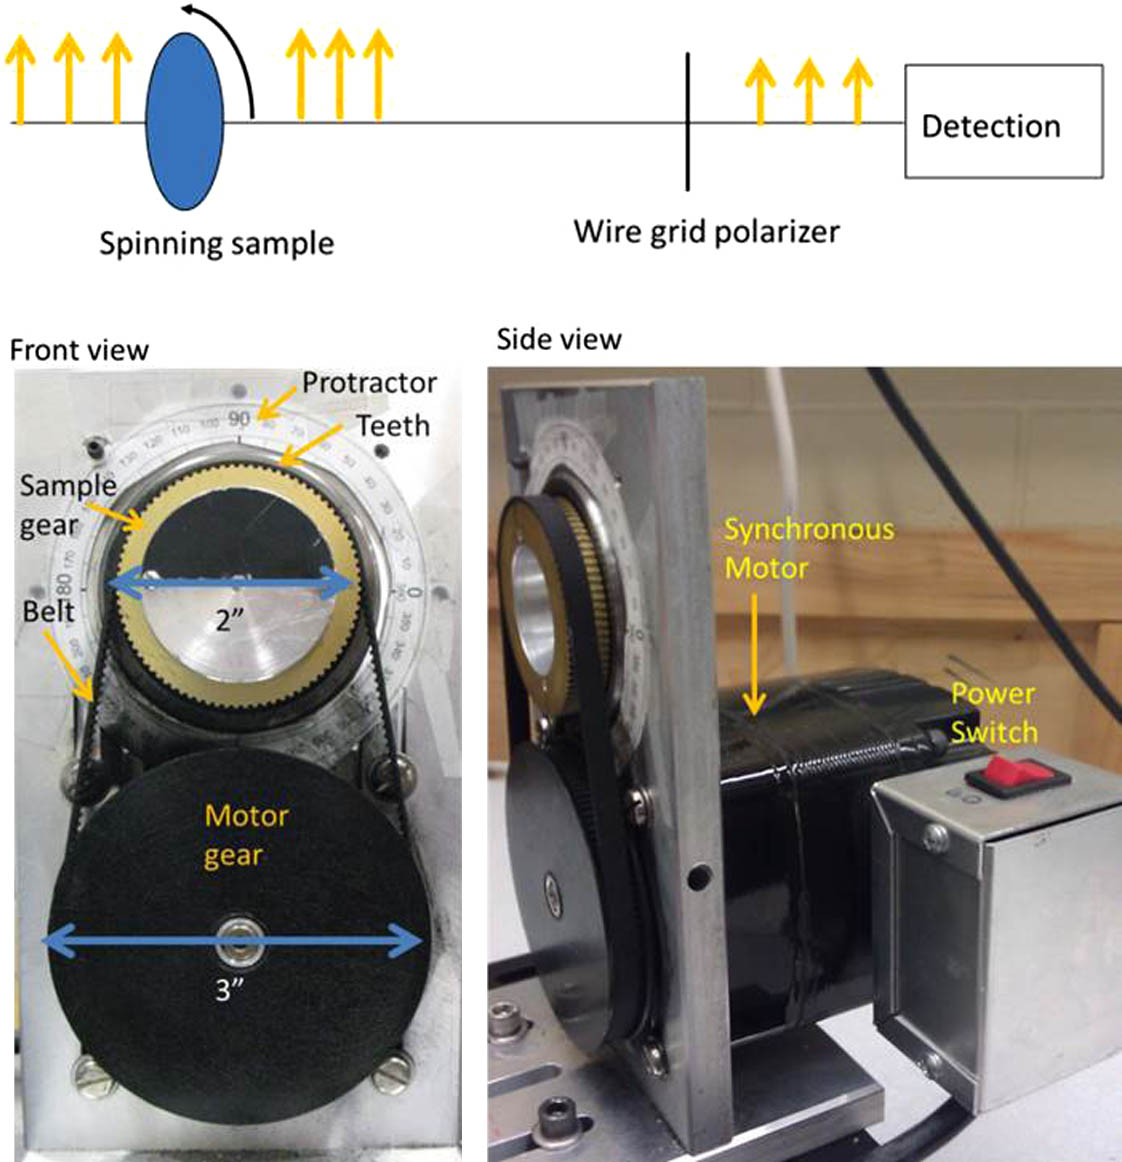
Fig. 2. Top, schematic of MOSTS optics; yellow arrows show direction of incident THz polarization. Bottom, photos of the sample rotator.
Fig. 3. MOSTS signals for an isotropic silicon wafer and for an anisotropic sample, a polarizer. (a) MOSTS time domain signal. Inset shows a standard THz TDS transmission measurement for the silicon wafer to contrast with the zero MOSTS waveform because MOSTS only measures anisotropy in the sample. (b) MOSTS field amplitude showing the broadband anisotropy of the polarizer and, again, zero signal for the isotropic silicon.
Fig. 4. Absorption coefficient and refractive index measurements of c a b
Fig. 5. MOSTS modeling and measurements of a c 4 . (b) Measured MOSTS waveform. (c) Calculated MOSTS field amplitude spectrum. (d) Measured MOSTS field amplitude spectrum.
Fig. 6. Absorption coefficient and refractive index measurements of a c b
Fig. 7. MOSTS modeling and measurements of an a 6 . (b) Measured MOSTS waveform. (c) Calculated MOSTS field amplitude spectrum. (d) Measured MOSTS field amplitude spectrum.
Fig. 8. (a) Absorption coefficient and refractive index measurements of c a b
Fig. 9. (a) THz TDS measurements of sucrose-polycarbonate model sample with THz polarization along the a b 8(b) .

Set citation alerts for the article
Please enter your email address
© Copyright 2018-2021 | Chinese Laser Press. All Rights Reserved 沪ICP备15018463号-20