Rohit Singh, Deepu Koshy George, Chejin Bae, K. A. Niessen, A. G. Markelz. Modulated orientation-sensitive terahertz spectroscopy[J]. Photonics Research, 2016, 4(3): 00A1
Copy Citation Text
Intramolecular vibrations of large macromolecules reside in the terahertz range. In particular, protein vibrations are closely spaced in frequency, resulting in a nearly continuous vibrational density of states. This density of vibrations interferes with the identification of specific absorption lines and their subsequent association with specific functional motions. This challenge is compounded with the absorption being dominated by the solvent and local relaxational motions. A strategy for removing the isotropic relaxational loss and isolating specific vibrations is to use aligned samples and polarization-sensitive measurements. Here, we demonstrate a technique to rapidlyattain the anisotropic resonant absorbance using terahertz time domain spectroscopy and a spinning sample. The technique, modulated orientation-sensitive terahertz spectroscopy (MOSTS), has a nonzero signal only for anisotropic samples, as demonstrated by a comparison between a silicon wafer and a wire grid polarizer. For sucroseand oxalic acid molecular crystals, the MOSTS response is in agreement with modeled results for the intermolecular vibrations. Further, we demonstrate that, even in the presence of a large relaxational background, MOSTS isolates underlying vibrational resonances.
The long-range intramolecular vibrations of proteins and other large macromolecules reside in the terahertz (THz) frequency range. Calculations have shown these motions may provide the molecule with efficient access to functional structural change for biomolecules as well as possibly enable allosteric control through the dynamics [1–6]. To date there has not been experimental proof of the relevance of these motions to biology, due to the challenge of measuring these motions and characterizing how they change with functional state and mutation. X-ray and coherent neutron inelastic scattering measurements are used to measure the vibrational density of states (VDOS), but these measurements are challenging, requiring of protein and specialized facilities [7–10]. In addition, the VDOS measurements cannot yet provide insight into the role of these motions in function because specific motions associated with structural change cannot be isolated. Optical techniques could potentially simplify the spectrum by isolating those vibrations with optical coupling. However, standard optical absorption spectra of proteins do not show the hoped for resonant absorption structure and, instead, find only a broad absorbance centered at [11–13], similar to the dielectric response of amorphous or glass-like materials. This broad absorption could be first understood as reflecting a majority of the intramolecular vibrations, which are optically active; thus, the optical absorbance reflects the broad VDOS. In addition to this, the amino acid side chains and the solvent will also contribute a strong background from relaxational dielectric loss [14,15].
It is tempting to simply remove all the water from a protein sample to at least eliminate this background; however, the molecular structure of proteins is highly dependent on the hydration, and the removal of water results in distinctly different material structure and dynamics. As the hydration decreases, the protein’s backbone structure is no longer well defined [16,17]. To study a uniform molecular sample with biologically relevant dynamics, the protein sample must be hydrated to at least 0.3 g water/g protein [16,17]. However, at this hydration level, the absorption from the water alone is very large [18–21]. In addition, the amino acid side chain librational motions can also contribute to a dielectric relaxation loss [22]. Thus, the broad VDOS along with relaxational contributions from local motions severely impede the isolating of specific intramolecular vibrations in the THz optical absorption of proteins.
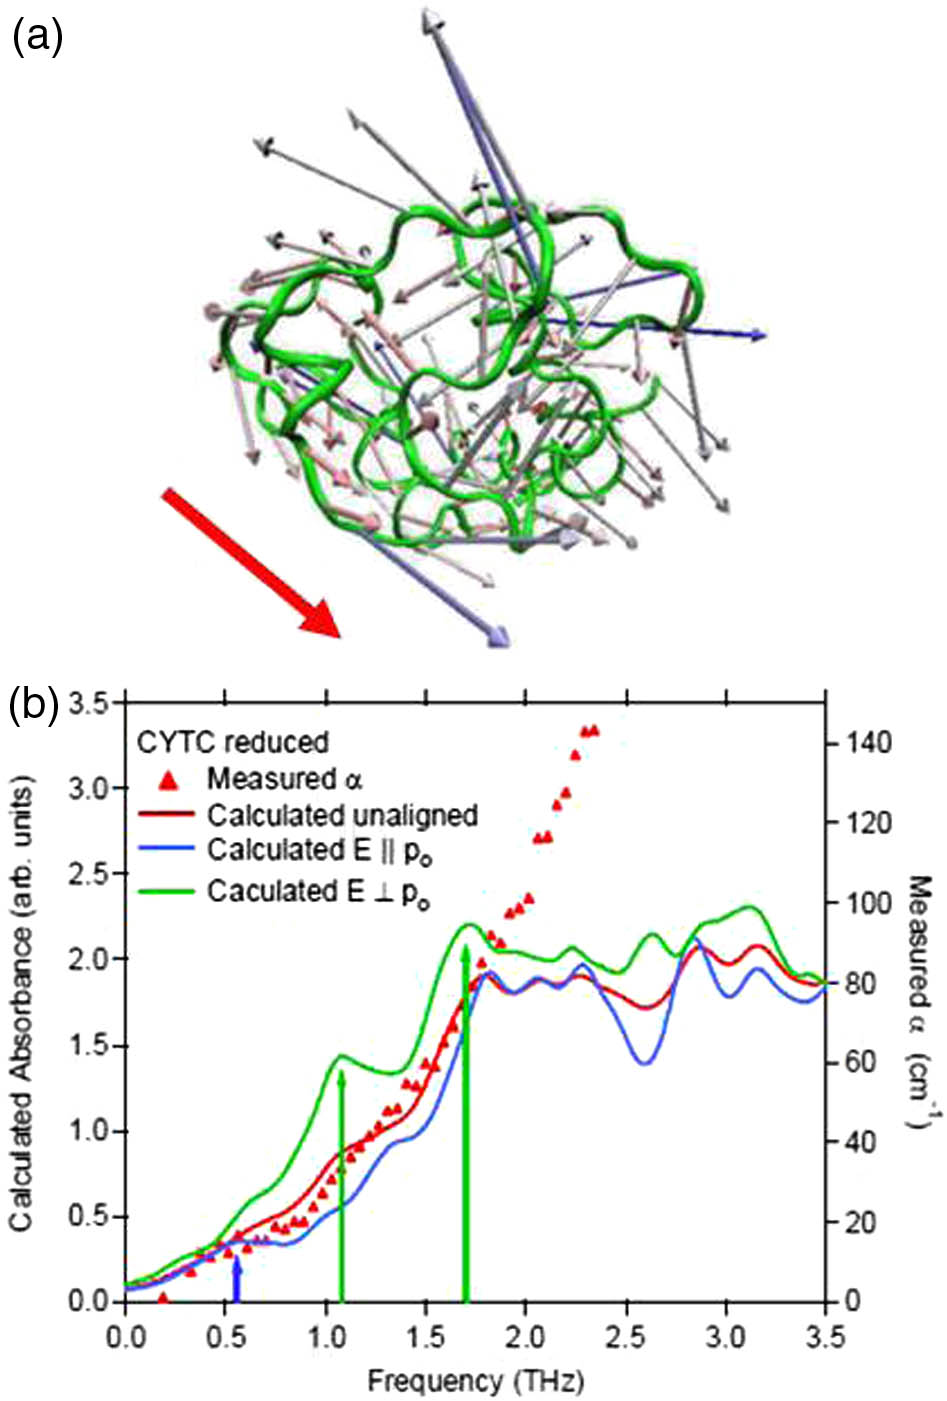
Anisotropic absorption measurements of aligned samples can overcome both of these challenges. The coupling of light to a vibrational excitation is dependent on the relative direction of the light polarization to the vibration’s transition dipole. Figure 1(a) shows a displacement vector diagram of an intramolecular vibration calculated for cytochrome using quasi-harmonic mode analysis. The overall dipole transition direction is indicated on the figure by the red arrow. The solvent molecules are randomly oriented over the surface of the protein. The net absorption for any polarization direction is given by where is the isotropic contribution, , , , are the vibrational resonant frequency, damping, dipole derivative, respectively, and is the light polarization direction. For the THz light polarization along the direction of the dipole transition, there will be absorption by the intramolecular vibration, and the relaxational loss of the solvent, whereas, for the perpendicular polarization, there will only be absorption from the relaxational loss. By modulating the polarization relative to the sample orientation, one can isolate the absorption from the intramolecular vibrations. In addition to the net removal of the relaxational contribution, the modulation can increase structure in the spectrum because of the directional dependence of the different vibrations. In Fig. 1(b), we show the calculated intramolecular vibrational absorption (relaxational loss is not included) for reduced cytochrome , for unpolarized and polarized light. As seen, there are frequency-dependent resonances specific to the polarization. Even in the case of unpolarized light, there is some structure in the absorbance, with a plateau occurring at 1.7 THz. Also shown in the figure is the measured absorbance for the hydrated reduced-cytochrome film. The plateau is not apparent in the data, illustrating the dominance of the isotropic relaxational contribution.
Sign up for Photonics Research TOC. Get the latest issue of Photonics Research delivered right to you!Sign up now
Figure 1.(a) Displacement vector diagram for intramolecular vibration at for cytochrome , calculated using quasi-harmonic mode analysis. Transition dipole is indicated by the red arrow. (b) Calculated polarization dependent absorption from the intramolecular vibrations for cytochrome c.
Here, we isolate the anisotropic signal using modulated orientation-sensitive terahertz spectroscopy (MOSTS). We find good agreement between modeling of the modulated signal and measurements for molecular crystals of oxalic acid and sucrose. We then apply the method to a model protein crystal sample with a large relaxational background. The MOSTS spectrum reveals intermolecular resonances that are a factor of 100 weaker than the background absorbance.
2. MATERIALS AND METHODS
A. THz Time Domain Measurements
A standard THz time domain spectroscopy (TDS) system is used to characterize the dielectric response for the samples in the 0.2–3 THz range. We use a mode-locked Ti:sapphire laser with 100 fs pulse width and centered at 800 nm (NIR). The 400 mW NIR beam is split into two beam paths: a THz generation path (350 mW) and NIR detection path (50 mW). THz light is generated by a photoconductive GaAs antenna with 80 μm electrode separation, which is AC biased (26 kHz, 120 V peak to peak). The THz light passes through the optical system and is detected using electro-optic (EO) detection using a 2 mm thick (011) ZnTe crystal. THz beam is focused onto the EO crystal, and the induced birefringence is probed using the NIR beam split off from the THz generating beam. A balanced photodiode is used to monitor the polarization of the NIR probe. The balance photodiode detector signal is fed to a lock-in amplifier using the AC bias frequency as the reference. A transmission measurement consists of toggling between a reference aperture and a sample aperture.
B. MOSTS
MOSTS uses several modifications to standard THz TDS. Mainly the photoconductive antenna is DC biased (60 V), and the sample is spinning at frequency . The balanced photodiode signal is still monitored with a lock-in, but with reference frequency at twice the sample spinning frequency. We found only the amplitude of the MOSTS waveform was affected by the relative phase of the lock-in and not the frequency content. Given this result, the phase was set to maximize the signal. As will be discussed, a straightforward analysis of this system is possible, however, the model assumes that the detection is perfectly polarization sensitive. EO detection does not have a simple sinusoidal polarization dependence [23]. To prevent discrepancies in the signal due to the polarization rotation by a birefringent sample resulting in a changing EO response, a stationary wire grid polarizer (5 cm diameter with 10 μm diameter wires and with 20 μm spacing between wires) is placed immediately after the sample.
The mount for the sample spinning consists of a gear attached to a circular ball bearing mount. The gear has a hole for the insertion of a circular sample plate. The demountable aluminum sample plates have a circular aperture at their center (diameters 4–10 mm). Half the sample plate is painted with black IR absorbing paint. An IR transceiver is mounted above the sample plate. As the plate spins, the changing reflectivity of the plate face provides the reference frequency of the rotation. The spinning frequency is typically 45 Hz. The sample plate gear is belt coupled to a servo motor shaft (Bodine Electric Company). A schematic of the optical setup and pictures of the spinning sample mount are shown in Fig. 2. Our current dynamic range is , which is less than the dynamic range of standard THz TDS. The reduction is primarily due to MOSTS low-modulation frequency due to the limitations of mechanical rotation of the sample.
Figure 2.Top, schematic of MOSTS optics; yellow arrows show direction of incident THz polarization. Bottom, photos of the sample rotator.
The linearly polarized THz pulse is incident on the rotating sample, transmits through the birefringent sample, and then transmits through the static wire grid polarizer. Using Jones matrix algebra, we have the linearly polarized vector is rotated into the sample’s frame with the angle of rotation being time dependent , where is the angular velocity of the rotating sample. The resulting vector is then propagated through the crystal with permittivity (where is the frequency of the THz light) for the field along an ordinary axis and for the field along the extraordinary axis. The field vector is then rotated back to the lab frame and transmitted through the polarizer: Substituting and solving the matrix, the output field vector is The field incident on the EO detector has both a time-independent part and an oscillatory part with frequency , which is due to the birefringence, and is zero for an isotropic sample. Thus, by locking into the signal at , we isolate the signal due to the anisotropy: If the incident field is known, one can calculate the normalized MOSTS signal; however, typical THz TDS systems have signal drift during the time it takes to remove or attach a sample to the rotating stage and reestablish a dry air environment. Here, we demonstrate that the direct MOSTS signal without referencing detects anisotropic resonances, even in the presence of a large isotropic background.
D. Samples
Standard THz TDS measurements are made on cytochrome films. Films are prepared by first dissolving cytochrome in tris buffer ph 7 at a concentration of . 10 μL is pipetted on one half of a water-free quartz slide and dried, resulting in a film with 1 cm diameter and 100 μm thick. The plate is placed in a hydration cell with two apertures, with the film-covered slide over one aperture, and the clean portion of the slide over the other as a reference. The cell is closed and hydrated nitrogen gas is circulated through the cell with a relative humidity of 80%.
Large oxalic acid and sucrose crystals were made using the seed-growth method. Sucrose and oxalic acid dihydrate powder were purchased from Sigma Aldrich. Sucrose was dissolved in pure DI water to saturation at 23°C. Small sucrose seeds were first grown by drying a saturated solution. Seeds were then hung in a beaker filled with clean saturated solution and were left for several days at room temperature. Oxalic acid crystal growth followed a procedure similar to that used in [24]. Seeds were formed by a drying a saturated solution of oxalic acid in DI water. For large dihydrate crystal growth, a saturated solution was made using a solvent of 75% acetone and 25% DI water. The seeds were hung in the saturated solution at 35°C. For both sucrose and oxalic acid crystals as large as were obtained, and habits were sufficiently clear that one could readily identify the crystal axes. The grown crystals were polished by hand along a specific crystal faces ( or ) to have a large area and be sufficiently thin so that the absorbance is within the dynamic range of the THz system. The polished thicknesses were between 300 and 1000 μm. The oxalic acid dihydrate and sucrose crystals grown had monoclinic symmetry. The and axes are 103° to each other but are 90° from axis. We note the and faces in sucrose are not perpendicular to and axes, respectively. Rather the face and face lie in the plane and plane, respectively.
The molecular crystal measurements were used to demonstrate MOSTS sensitivity to the anisotropic intermolecular vibrations. With this sensitivity, the method can be used to measure the intramolecular vibrations in proteins. To do so requires a sample of aligned protein molecules in a fully hydrated environment. Protein crystals provide the regular alignment and the full hydration (protein crystals are 30%–70% water by volume). To test whether the method can suppress a large isotropic background from the protein crystal waters, we tested MOSTS on a mock protein crystal sample. The mock protein crystal sample was made to simulate the anisotropic response of an ordered and oriented system embedded in a large relaxational background. To achieve this, a -face sucrose single crystal was attached to a thick polycarbonate substrate.
3. RESULTS
A. Anisotropic Isolation
Figure 1(b) shows the absorbance for a cytochrome hydrated film. The absorbance increases monotonically with frequency through the range of 0.2–2.0 THz and is typical for an unaligned protein sample. As discussed, this frequency dependence is due to both the dense VDOS for the complex macromolecule and the isotropic background from the librational motions of the solvent and amino acid side chains. Equation (4) shows that MOSTS only measures anisotropy in the permittivity. Thus, MOSTS would be insensitive to the isotropic background and be able to detect narrowband features associated with specific intramolecular vibrations. We test MOSTS sensitivity to anisotropy by comparing the signal from an isotropic and anisotropic sample. A standard silicon wafer is used as an isotropic sample. The unintentionally doped silicon has no phonons in this frequency range and has no lattice birefringence. Because of the background charge density of , there will be absorbance in the THz range from the ohmic loss, known as Drude absorption. This free-carrier absorption is independent of the light polarization. A wire grid polarizer (5 cm diameter with 10 μm diameter wires and with 20 μm spacing between wires) with a broadband power extinction ratio of 900 is used as an ideal anisotropic sample. In Fig. 3 we show that, indeed, the MOSTS method only detects anisotropic transmission changes. Figure 3(a) shows there is no MOSTS signal for the doped silicon wafer, even though a transmitted waveform was readily measured using THz TDS, as shown in the inset. The MOSTS waveform for the rotating polarizer, on the other hand, is nearly identical to a reference THz TDS waveform. Based on the polarizer waveform and the THz TDS data for the wafer in the inset, we expect that the MOSTS waveform for the silicon wafer would appear at 25 ps ( after polarizer waveform). The lack of any MOSTS waveform for the silicon wafer even out to 35 ps indicates there is no MOSTS signal for the isotropic sample. Further, this also indicates that the signal for the polarizer does not come from some other modulation such as an off-center spinning aperture, as this same modulation would be present for the silicon wafer measurement. Figure 3(b) shows the power spectra of the two samples, with a zero spectrum for the Si wafer, whereas, for the polarizer, the MOSTS power spectrum is nearly identical to that of the THz TDS power spectrum, as expected for the broadband extinction for this polarizer. The MOSTS signal exclusively measures anisotropic changes in transmission.
Figure 3.MOSTS signals for an isotropic silicon wafer and for an anisotropic sample, a polarizer. (a) MOSTS time domain signal. Inset shows a standard THz TDS transmission measurement for the silicon wafer to contrast with the zero MOSTS waveform because MOSTS only measures anisotropy in the sample. (b) MOSTS field amplitude showing the broadband anisotropy of the polarizer and, again, zero signal for the isotropic silicon.
Measurements on molecular crystals test the sensitivity of MOSTS to different degrees of anisotropy and whether resonant absorption can be detected. Molecular crystals have strong resonant absorption in the THz range arising from intermolecular crystal lattice vibrations [25]. The absorption for a c-cut oxalic acid dihydrate single crystal is shown in Fig. 4. An intermolecular resonance at 1.4 THz is observed the THz electric field -axis, whereas there is a resonance at 1.8 THz for -axis, in agreement with previous measurements [26,27]. Also shown is the refractive index along the two directions. There is a substantial birefringence over the entire frequency range as well as anomalous dispersion at the resonant absorption frequencies. We fit these measurements to simple expressions: for the ordinary, , and extraordinary, , permittivities. Here, , , and are the frequency, oscillator strength, and linewidth for the jth resonance along the ordinary (extraordinary) axis, respectively [28]. The extracted parameters and the reference waveform are used in Eq. (4) to calculate the expected MOSTS field detected at for a crystal of thickness . In Fig. 5, we show the calculated and measured results for a 500 μm thick c-cut oxalic acid dihydrate crystal. Figures 5(a) and 5(b) show the results of the calculated and measured waveforms, respectively. The modeled waveform reproduces the same distortions seen in the measured waveform, such as the ringing from the resonant absorption features. In Figs. 5(c) and 5(d), we see the power spectra from the model and measurement, respectively. The spectra are broadband as expected from broadband birefringence leading to broadband modulation of the waveform phase for the spinning sample. In addition, we see inflections in the spectra that correspond to the 1.4 and 1.8 THz intermolecular crystal vibrations. The calculated inflections are larger than those in the model calculation, suggesting that the initial fits to the crystal phonons was not sufficiently accurate.
Figure 4.Absorption coefficient and refractive index measurements of -face oxalic acid dihydrate single monoclinic crystals measured using THz TDS. Measurements shown are for the THz electric field parallel to the crystal’s axis and parallel to the axis.
Figure 5.MOSTS modeling and measurements of a -face oxalic acid dihydrate single crystal. (a) Calculated MOSTS waveform from parameters extracted from Fig. 4. (b) Measured MOSTS waveform. (c) Calculated MOSTS field amplitude spectrum. (d) Measured MOSTS field amplitude spectrum.
In Fig. 6 we show the THz TDS measured absorbance and refractive index for a 550 μm thick -face sucrose single crystal for both axis and axis. The results are consistent with previous non-oriented and single crystal measurements [27,29,30]. There is considerably more complexity in the anisotropic absorbance compared with oxalic acid. On the other hand, the birefringence is very slight except at the resonances. Again, we extract the parameters needed for our permittivity model and apply Eq. (4) to calculate the expected MOSTS signal. In Figs. 7(a) and 7(b), we show the modeled and measured MOSTS waveforms for a 1 mm thick -face sucrose crystal. The calculated and measured field amplitude spectra are shown in Figs. 7(c) and 7(d), respectively. The calculated and measured field spectra are more narrow than for the oxalic acid, due to the narrower region of birefringence. The MOSTS power spectrum has inflections occurring at the absorption resonances at 1.55, 1.72, and 2.05 THz. These frequencies appear to be most closely associated with resonant absorbances seen for for 1.55 THz and for for the others. While MOSTS cannot be used to extract highly accurate spectra, the key feature is that it is sensitive to the anisotropy in a single measurement. Later, we show how this can be used to extract resonances from a strong isotropic background.
Figure 6.Absorption coefficient and refractive index measurements of -face sucrose single monoclinic crystal measured using THz TDS. Measurements shown are for the THz electric field parallel to the crystal’s axis and parallel to the axis.
Figure 7.MOSTS modeling and measurements of an -face sucrose single crystal. (a) Calculated MOSTS waveform from parameters extracted from Fig. 6. (b) Measured MOSTS waveform. (c) Calculated MOSTS field amplitude spectrum. (d) Measured MOSTS field amplitude spectrum.
Figure 8(a) shows the THz TDS measured absorbance and refractive index for a -face sucrose single crystal for both axis and axis. The spectra and birefringence are highly similar to the -face data; however, the MOSTS field amplitude spectrum in Fig. 8(b) is somewhat more narrow and overlaps only the region where there is strong birefringence and anisotropy due to the resonances. The contrast with the -face data suggests that there is less net birefringence between the and axes than the THz TDS results indicate in Fig. 8(a). Here, we note that we have focused on the amplitude of the power spectrum of the MOSTS signal; however, the phase of the MOSTS signal can also be examined. Unlike typical THz TDS measurements where the relative phase delay for the transmission of a static sample can be used to determine the refractive index, as the MOSTS signal is only measuring the anisotropy; because we are applying the technique without a reference, an absolute refractive index cannot be attained. Here, we evaluate a relative refractive index defined by where is the frequency dependent phase from the Fourier transform of the MOSTS waveform. As shown in Fig. 8(b), the extracted relative index shows inflections at frequencies with large birefringence at 1.55, 1.72, and 2.05 THz.
Figure 8.(a) Absorption coefficient and refractive index measurements of -face sucrose single monoclinic crystal measured using THz TDS. Measurements shown are for the THz electric field parallel to the crystal’s axis and parallel to the axis. (b) MOSTS field amplitude.
The MOSTS spectra for the molecular crystals demonstrate that the technique measures anisotropic response with features corresponding to vibrational resonances. To apply the technique to measuring protein intramolecular vibrations, it must provide the necessary isotropic suppression to observe vibrational resonances above a strong relaxational background. To determine if MOSTS can remove a large isotropic background and still expose anisotropic resonances, we measure a mock protein sample where we have both a well-ordered system with strong anisotropy and a large isotropic background. This mock protein sample consists of a sucrose single crystal glued to a polycarbonate substrate. The polycarbonate substrate has a somewhat smaller THz absorption than water but has a similar frequency dependence. The thickness of the polycarbonate was set so the absorbance was equal to that of the sucrose crystal at 1.9 THz. A 5 mm thick polycarbonate plate fulfilled this condition for a 560 μm thick -face sucrose crystal.
In the Fig. 9(a) inset, we show a schematic of the model protein sample. Figure 9(a) shows the THz TDS measurements of the model sample for the polarization along the sucrose crystal’s axis (0°) and along the axis (90°). There are no sharp resonances observed corresponding with the narrow resonances seen in Fig. 6. Rather, the monotonic nearly power law frequency dependence is highly reminiscent of THz measurements of protein hydrated films, as seen in Fig. 1(b)[31]. MOSTS measurements of the model sample are shown in Figs. 9(c) and 9(d). Unlike the purely isotropic silicon wafer sample, an MOSTS waveform is detected. The field amplitude spectrum in Fig. 9(d) reveals at least two prominent resonances at 1.55 and 2.0 THz, just as detected for the pure -face crystal seen in Fig. 8(b). We note that one might also identify the 1.7 THz inflection seen in Fig. 8(b); however, this is not above the noise level in the rest of the spectrum and would presumably not be identified for an actual protein sample. This exciting result shows that the technique can indeed extract anisotropic features from a strong isotropic background.
Figure 9.(a) THz TDS measurements of sucrose-polycarbonate model sample with THz polarization along the axis of the sucrose (0°) and along the axis (90°). (b) Difference in the absorption coefficient measured in (a) showing no obvious frequency dependent features. (c) MOSTS waveform of model sample and (d) field amplitude of MOSTS signal showing clear resonances at 1.55 and 2.05 THz as seen for the c-cut sucrose in Fig. 8(b).
A variety of modulation techniques have been developed over the last 10 years for THz polarimetry [32–38]. Initial measurements to measure the AC Hall effect used static polarizers, one before the sample and one after, both set at 45 deg from the emission and detection polarization maxima. A measurement consists of the transmission for the two polarizer set in parallel and in crossed configurations. This is a highly precise method but can be inconvenient without automated rotation. Several groups have used rotating polarizers to determine the full conductivity tensor of solid state materials in a magnetic field [35–37]. The main disadvantage of polarizer spinning techniques is that both the polarization and the field amplitude are modulated. This issue could easily be resolved by having circularly polarized THz light, thus eliminating any field amplitude variation as the polarizer is rotated. Unfortunately, broadband quarter-wave plates are not yet commercially available.
Previous THz polarimetry measurements have focused on the measurement of circular dichroism that is present in materials in a magnetic field. In the case of protein intramolecular vibrations, we are interested in measuring the linear dichroism. In the case of circular dichroism, the spinning of the sample with the axis along the direction of light propagation will not provide any modulation; however, in the case of linear dichroism, it provides a substantial modulation.
The MOSTS technique was highly successful for the model protein sample and suggests that the overall method may enable rapid characterization of intramolecular dynamics for proteins as a function of small molecule binding or protein structural change. However, there are a number of challenges to realize the potential of MOSTS measurements. The first is that these are far-field measurements, and the protein sample must be larger than the diffraction limited spot size of the THz light. Protein crystals can readily be grown to 300 μm lateral dimensions, so this is achievable. Other challenges are to have a fully hydrated protein crystal, and that the crystal be sufficiently strongly attached to the spinning allow for the spinning of the mounting plate. Protein crystals are typically prepared for x-ray diffraction measurements by capturing the crystal along with its mother liquor in a small wire loop and then flash freezing with liquid nitrogen before mounting in the x-ray beam. The sample remains frozen by exposure to a steady stream of liquid nitrogen gas at flowing over the sample. Such an overall protocol could be adapted for MOSTS measurements, with the protein crystal being held in the spinning plate aperture first by the surface tension of the surrounding mother liquor and then flash frozen.
We note that the results in Fig. 9(b) are equivalent to performing static measurements as a function of orientation for protein crystals and taking differences in the spectra. Such measurements have recently been performed using near-field THz microscopy and had considerably better results than those shown for the model sample [39,40].
5. CONCLUSION
MOSTS successfully characterized the anisotropic features against a large relaxational background. Intramolecular vibrations of proteins have been in the realm of theoretical speculation, with essentially no experimental data to test the sensitivity of the vibrations to a mutation and functional state, much less test if tailoring the dynamics can influence function. MOSTS is a feasible method for such characterization measurements. In addition, the method may also be useful when isotropic backgrounds present a challenge for other materials.
[14] S. Ebbinghaus, S. J. Kim, M. Heyden, X. Yu, U. Heugen, M. Gruebele, D. M. Leitner, M. Havenith. An extended dynamical hydration shell around proteins. Proc. Natl. Acad. Sci. USA, 104, 20749-20752(2007).
[20] H. Frauenfelder, P. W. Fenimore, G. Chen, B. H. McMahon. Protein folding is slaved to solvent motions. Proc. Natl. Acad. Sci. USA, 103, 15469-15472(2006).
[28] J. D. Jackson. Classical Electrodynamics(1975).
[29] M. Walther, B. M. Fischer, P. U. Jepsen. Noncovalent intermolecular forces in polycrystalline and amorphous saccharides in the far infrared. Chem. Phys. Lett., 288, 261-268(2003).