Author Affiliations
1School of Computer Science & Information Engineering, Shanghai Institute of Technology, Shanghai 201418, China2School of Sciences, Shanghai Institute of Technology, Shanghai 201418, Chinashow less
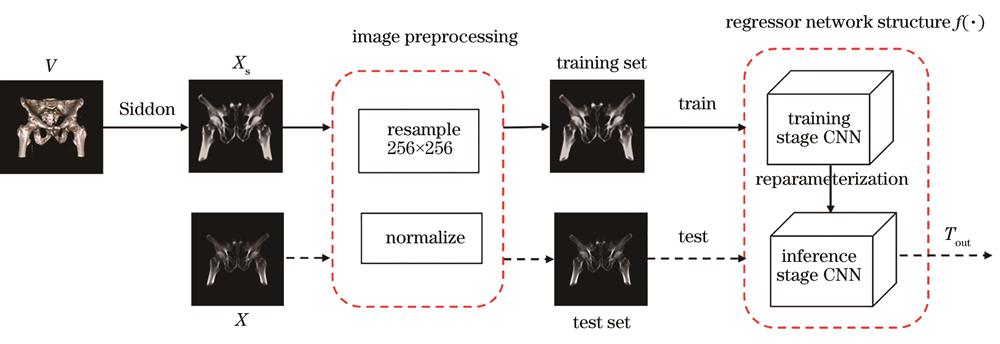
Fig. 1. Registration framework
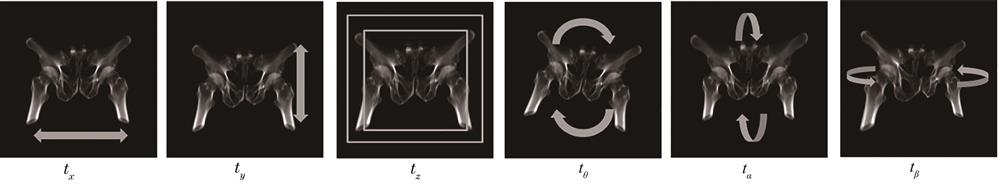
Fig. 2. Transform parameter renderings
Fig. 3. Network structure of regressor
Fig. 4. Re-parameterization process
Fig. 5. Activate function. (a) ReLU/Swish; (b) ACON-C under different parameters
Fig. 6. Parameter error box diagrams. (a) Translation error; (b) angular error
Fig. 7. Registration rendering. (a) Reference image; (b) moving image; (c) registrated checkerboard rendering
| Parameter | Distribution range |
|---|
| tx /mm | U(-20, 20) | | ty /mm | U(-20, 20) | | tz /mm | U(-10, 10) | | tθ /(°) | U(-10, 10) | | tα /(°) | U(-10, 10) | | tβ /(°) | U(-5, 5) |
|
Table 1. Transformation parameter distribution
| Structure | Number of images /104 |
|---|
| Training set | Test set | Data set |
|---|
| Pelvis | 3 | 1 | 4 | | Chest | 3 | 1 | 4 |
|
Table 2. Number distribution of the datasets
| Batchsize | T-MAE /mm | R-MAE /(°) | RMSE |
|---|
| 8 | 0.08 | 0.05 | 0.08 | | 16 | 0.10 | 0.06 | 0.09 | | 32 | 0.15 | 0.12 | 0.12 |
|
Table 3. Comparison of network hyperparameters
| Dataset | Network structure | T-MAE /mm | R-MAE /(°) | RMSE |
|---|
| Pelvis | No branch | 0.103 | 0.073 | 0.115 | | Identity | 0.087 | 0.062 | 0.098 | | 1×1 Conv | 0.083 | 0.057 | 0.093 | | Proposed method | 0.075 | 0.051 | 0.084 | | Chest | No branch | 0.155 | 0.099 | 0.169 | | Identity | 0.147 | 0.088 | 0.156 | | 1×1 Conv | 0.129 | 0.082 | 0.143 | | Proposed method | 0.115 | 0.068 | 0.125 |
|
Table 4. Error comparison of branch structure ablation experiments
| Network structure | Parameter /106 | T-time /ms | I-time /ms |
|---|
| No branch | 50.98 | 29.8 | 25.7 | | Identity | 50.98 | 30.2 | 25.8 | | 1×1 Conv | 56.53 | 33.2 | 25.8 | | Proposed method | 56.53 | 34.6 | 26.0 |
|
Table 5. Time comparison of branch structure ablation experiments
| Dataset | Activation function | T-MAE /mm | R-MAE /(°) | RMSE |
|---|
| Pelvis | ReLU | 0.078 | 0.052 | 0.087 | | Swish | 0.079 | 0.053 | 0.088 | | ACON-C | 0.078 | 0.052 | 0.087 | | Meta-ACON | 0.075 | 0.051 | 0.084 | | Chest | ReLU | 0.143 | 0.084 | 0.156 | | Swish | 0.151 | 0.082 | 0.162 | | ACON-C | 0.129 | 0.077 | 0.129 | | Meta-ACON | 0.115 | 0.068 | 0.125 |
|
Table 6. Activation function comparison
| Dataset | Network structure | T-MAE | R-MAE | RMSE | Time /ms |
|---|
| Pelvis | GoogLeNet | 0.36±0.19 | 0.23±0.13 | 0.39±0.24 | 16.0 | | VGG16 | 0.32±0.27 | 0.21±0.18 | 0.35±0.21 | 19.2 | | ResNet50 | 0.09±0.08 | 0.06±0.07 | 0.10±0.08 | 18.4 | | DenseNet121 | 0.11±0.08 | 0.07±0.06 | 0.12±0.09 | 34.5 | | Net+GradNCC[11] | 7.83±19.8 | 4.94±8.78 | | | | Proposed method | 0.08±0.04 | 0.05±0.03 | 0.08±0.06 | 26.0 | | Chest | GoogLeNet | 0.41±0.18 | 0.16±0.09 | 0.39±0.20 | 21.5 | | VGG16 | 0.56±0.45 | 0.31±0.24 | 0.60±0.41 | 19.1 | | ResNet50 | 0.33±0.09 | 0.20±0.05 | 0.35±0.12 | 24.6 | | DenseNet121 | 0.15±0.08 | 0.09±0.05 | 0.16±0.08 | 37.0 | | Inception+branch[10] | 0.61 | 1.93 | | 2.3 | | Proposed method | 0.12±0.07 | 0.07±0.04 | 0.13±0.08 | 26.4 |
|
Table 7. Comparison of registration effects of different networks
| Dataset | Method | NCC | NMI | SSIM | Time /ms |
|---|
| Pelvis | NCC_Powell | 0.56±0.07 | 0.16±0.02 | 0.57±0.09 | 96.4×10³ | | NMI_Powell | 0.61±0.09 | 0.15±0.01 | 0.57±0.09 | 28.6×10³ | | Deep learning method[9] | 0.82±0.07 | 0.32±0.03 | | 30.0 | | Proposed method | 0.99±0.05 | 0.72±0.03 | 0.99±0.08 | 26.0 | | Chest | NCC_Powell | 0.53±0.11 | 0.11±0.02 | 0.55±0.09 | 101.5×10³ | | NMI_Powell | 0.57±0.09 | 0.11±0.02 | 0.58±0.08 | 29.2×10³ | | Inception+branch[10] | | | 0.42 | 2.3×10³ | | Proposed method | 0.99±0.06 | 0.56±0.02 | 0.99±0.09 | 26.4 |
|
Table 8. Comparison of registration methods