Guangchao Ye, Rongwei Fan, Zhaodong Chen, Xinrui Xu, Ping He, Deying Chen. Effect of time bin size on accuracy of streak tube imaging lidar[J]. Chinese Optics Letters, 2016, 14(2): 021101
Copy Citation Text
Streak tube imaging lidar (STIL) is an active imaging system that has a high range accuracy with the use of a pulsed laser transmitter and streak tube receiver to produce 3D range images. This work investigates the effect of the time bin size on the range accuracy of STIL systems based on the peak detection algorithm. The numerical simulation indicates that the time bin size has a significant effect on the range accuracy, resulting in a modified analytical estimate of the range error. An indoor experiment with a planar target is carried out to validate the theory that shows the linear relationship between the range error and the time bin size. Finer 3D depth images of a fist model are acquired by using a smaller time bin size and the best range error of 0.003 m is achieved with the optimal time bin size of 0.07 ns.
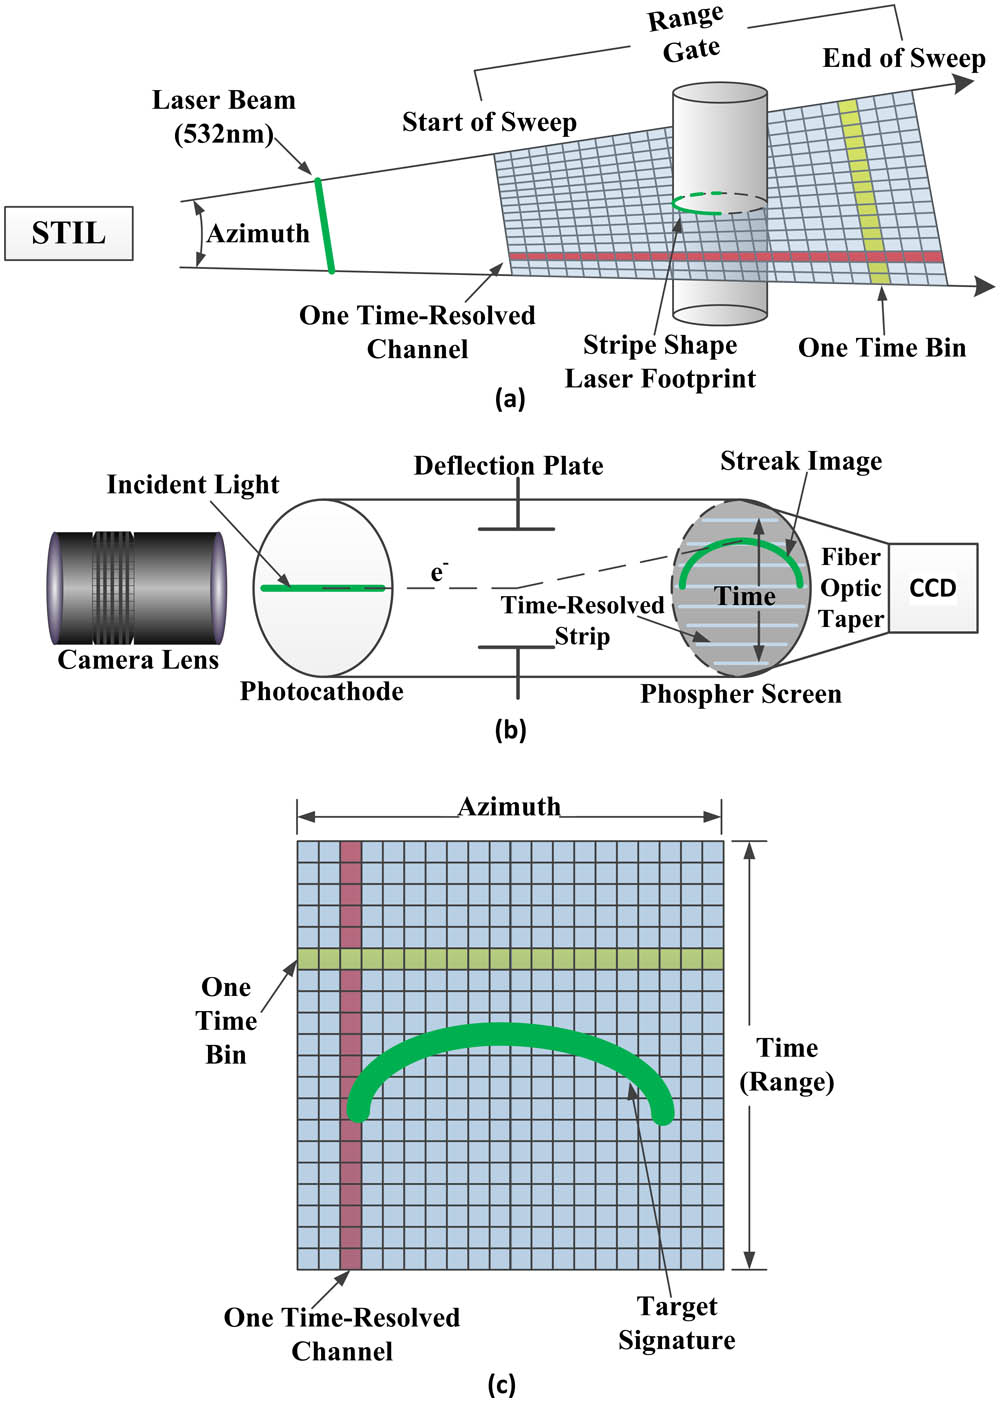
Streak tube imaging lidar (STIL) has attracted a great deal of attention in recent years because of its high range accuracy, wide field-of-view (FOV), and high frame rate[1–5]. This technique has been widely applied in target identification and 3D scene imaging[6–9]. A typical STIL architecture is depicted in Figs. 1(a) and 1(b). The laser is projected into the scene as a fan beam, forming a strip-shaped footprint on the target. Afterward, the scattered target return is collected and recorded by the streak tube detector, which is usually coupled with a smart CCD[10,11]. A pair of deflection plates with a time-dependent voltage is applied to separate the signal captured by the CCD along the vertical direction, according to the different arrival times of the target return. As shown in Fig. 1(c), each column of the CCD image represents a time-resolved channel, while each row represents a time bin. Finally, a 3D image can be reconstructed from multiple pulses by scanning the scene with a 1D laser fan beam[1,12–14].
Figure 1.(a) Schematic diagram of the STIL data collection process, (b) illustration of the work principle of the streak tube detector, and (c) the streak image at the phosphor screen, as captured by the CCD.
Range accuracy is one of the most critical features of imaging lidar systems[15–17]. Gleckler et al. have reported that the achievable range error for an STIL system can be estimated by[5,7,8,18]where is the speed of light, is the pulse width of the laser, and SNR is the signal-to-noise-ratio. It is apparent from Eq. (1) that the range accuracy is restricted by the laser pulse width, which is hard to change for a laser transmitter.
In this Letter, we aim to investigate the effect of time bin size on the range accuracy of an STIL system. Based on the numerical simulation, a modified range error model is presented and validated by an indoor experiment. The 3D depth images are improved by using the optimal time bin size.
Sign up for Chinese Optics Letters TOC. Get the latest issue of Chinese Optics Letters delivered right to you!Sign up now
Time bin size depends on the slope of the linear voltage ramp applied on the deflection plates, which could be regulated by changing the parameters of the sweep circuit. Therefore, it is more convenient to change in contrast to the fixed laser pulse width in a specified STIL system. So, it is significant to investigate the relationship between and range accuracy, and we carried out a numerical simulation on the range error of STIL system.
Generally, the range error of a STIL system could be calculated by[16,19]where is the calculated time of flight (TOF) of the laser pulse of the th time-resolved channel, is the real TOF of the laser pulse, and is the total number of time-resolved channels. A raw streak image of the laser echo can be simulated according to the given parameters, including , , SNR, , and . Then, is calculated by determining the peak position of the time-resolved signal of the simulated image. Using Eq. (2), we get the simulation estimate of the range error. The relationship between and range error is obtained, as shown in Fig. 2, when the other parameters are fixed (, , , ). It is evident that the range error deteriorates with increasing and the dependence curve shows a good linear relationship, with a slope of . Therefore, Eq. (1) should be rewritten as where can be calculated through the simulation result . Consequently, a modified range error is determined by To verify the theory, an indoor experiment was carried out using a planar target at a fixed distance of 10 m. The schematic of the indoor experiment is shown in Fig. 3. A Q-switched solid-state laser with a wavelength of 532 nm, a pulse repetition rate of 1000 Hz, a pulse width of 1 ns, and a typical maximum average output power of 30 mW was employed as the illumination source. Using a beam shaper consisting of three cylindrical lenses, the laser was spread out into a wide azimuth (1.2°) and narrow elevation (0.003°) fan beam to be projected onto the scene as a line. The scattered target return was collected using an 80 mm aperture Nikon lens with a focal length of 300 mm and was imaged onto the photocathode of the streak tube with an imaging resolution of 40 lp/mm. Spectral and spatial filtering of the return signal was applied in front of the streak tube to ensure that, even under bright daylight conditions, the background illumination noise was limited. The electrons converted from the scattered target return were accelerated to the 20 mm diameter phosphor screen using the electric field between the photocathode and the phosphor screen. The streak tube can provide an intensity magnification of 0.7 to 1.5 of the incident light. The time bin size could be changed by regulating the slope of the linear voltage ramp. A cascade intensified CCD with a resolution of pixels and a max gain of was used to capture the images on the phosphor screen, leading to an azimuth resolution of 0.0024° in the horizontal direction. The laser, the streak tube, and the CCD were synchronized using three independent triggers provided by a digital delay generator, with a 50 ps typical timing jitter.
Figure 2.Simulated dependence of range error on the time bin size. The simulation parameters are , , , and .
Generally, a typical SNR of an STIL system is given by where denotes the average signal intensity of a time-resolved channel and represents the standard deviation of the noise. Not being related to , only depends on the parameters of the receiving system, such as the dark current of the CCD, the shot noise of the streak tube, and the intensity of the background illumination. The average signal intensity is calculated by , where stands for the maximum signal intensity. Using a fixed output laser power and laser pulse width, will increase with . Therefore, the laser output power should be reduced using an attenuator to control precisely. As a result, we can keep the SNR at nearly the same value when utilizing different values.
Figure 4 shows four depth data with a fixed SNR of 27.5, using different values (0.07, 0.18, 0.36, and 0.18 ns). It is apparent that a smaller leads to a smaller jitter around the real distance (10 m), resulting in a better range accuracy. Then, using Eq. (2), the range errors are determined as 0.003, 0.008, 0.017, and 0.032 m, which is consistent with our analytical estimate in Eq. (4) and previous numerical simulation, as shown in Fig. 5.
Figure 4.Depth data of the planar target using different time bin sizes.
Consequently, the range accuracy can be improved by decreasing the time bin size. Figure 6 shows a more obvious illustration of the effects of on the range accuracy improvement using 3D images of a target. A fist model with a stand-off distance of 10 m was scanned with a 1D laser fan beam by the STIL system, using different values. The 3D rendered depth images were reconstructed and color coded from the individual raw streak images with an average SNR of 31. The close-up photographs in column Fig. 6(a) are different viewpoints of the target that was scanned. Depth images of the target obtained for time bin sizes of 0.07, 0.18, 0.36, and 0.18 ns are shown in columns Figs. 6(b) to 6(e)—each of these columns shows three different views, corresponding to column Fig. 6(a), with the specified time bin size. The 1D laser fan beam covered an area of approximately 1.2°, resulting in an azimuth resolution of approximately 0.0024° in horizontal direction, which is clearly evident in the face-on view shown in the top row.
Figure 6.3D-rendered depth images of a fist model from a stand-off distance of 10 m, using different time bin sizes. The close-up photographs in column (a) are different viewpoints of the target that was scanned. Plots of the depth data obtained for time bin sizes of 0.07, 0.18, 0.36, and 0.78 ns are shown in columns (b) to (e); each of these columns show three different viewpoints.
The 3D images of columns Figs. 6(b) to 6(e) clearly show that the depicted plots with smaller values are obviously finer than those with larger ones. It is much easier to distinguish each finger from the images in column Fig. 6(b) than those in column Fig. 6(e). Moreover, the segment in rectangle A should have different distances. It is apparent from the top row that only column Fig. 6(b) can describe the range difference precisely, while column Fig. 6(e) renders this segment with the same color (distance). The range in meters is color coded and the relative position of the segment in rectangle A can be correctly rendered by column Fig. 6(b)—the left part is further than the right part—which coincides with the actual target. A side-on view in the bottom row helps us gain a clear side outline of the target. It is evident that images with smaller values can depict the side outline better while, in contrast, images with larger values can hardly identify the main shape of the fist. From the oblique view in the middle row, we can also find that the images with larger values make more noise than those with smaller values. As a result, the range accuracy of the depth images could be enhanced by using a smaller time bin size.
In conclusion, the effect of the time bin size on the range accuracy of the STIL system is analyzed. The simulation results show that the range error is in direct proportion to and the slope of the linear fitting result is obtained. A modified analytical estimate of the range error including is presented and validated by experimental results. It indicates that has a significant effect on the range accuracy and the smaller can help to reduce the range error. However, it is worth noting that smaller will result in a narrower range gate. So, an adequate range gate needed by the target should be guaranteed before choosing the optimal time bin size. In the experiments with a planar target, the finest range accuracy of 0.003 m is obtained using the smallest time bin size of 0.07 ns, and the dependence curves between the range error and are consistent with the theoretical analysis. The 3D depth images of a fist model show an obvious illustration of the effects of on the range accuracy improvement. The finer millimeter-scale 3D images are obtained by reducing the time bin size. The work presented here is useful for the design and evaluation of STIL systems.
Guangchao Ye, Rongwei Fan, Zhaodong Chen, Xinrui Xu, Ping He, Deying Chen. Effect of time bin size on accuracy of streak tube imaging lidar[J]. Chinese Optics Letters, 2016, 14(2): 021101