• Advanced Photonics
  • Vol. 2, Issue 6, 065002 (2020)
Cheng Zheng1、2, Di Jin3, Yanping He1, Hongtao Lin4, Juejun Hu5, Zahid Yaqoob6, Peter T. C. So2、6、7, and Renjie Zhou1、8、*
Author Affiliations
  • 1The Chinese University of Hong Kong, Department of Biomedical Engineering, Hong Kong, China
  • 2Massachusetts Institute of Technology, Department of Mechanical Engineering, Cambridge, Massachusetts, United States
  • 3Massachusetts Institute of Technology, Computer Science and Artificial Intelligence Laboratory, Cambridge, Massachusetts, United States
  • 4Zhejiang University, College of Information Science and Electronic Engineering, Hangzhou, China
  • 5Massachusetts Institute of Technology, Department of Materials Science and Engineering, Cambridge, Massachusetts, United States
  • 6Massachusetts Institute of Technology, Laser Biomedical Research Center, Cambridge, Massachusetts, United States
  • 7Massachusetts Institute of Technology, Department of Biological Engineering, Cambridge, Massachusetts, United States
  • 8The Chinese University of Hong Kong, Shun Hing Institute of Advanced Engineering, Hong Kong, China
  • show less
    DOI: 10.1117/1.AP.2.6.065002 Cite this Article Set citation alerts
    Cheng Zheng, Di Jin, Yanping He, Hongtao Lin, Juejun Hu, Zahid Yaqoob, Peter T. C. So, Renjie Zhou. High spatial and temporal resolution synthetic aperture phase microscopy[J]. Advanced Photonics, 2020, 2(6): 065002 Copy Citation Text show less
    (a) Schematic of the HISTR-SAPM setup. DMD1 and DMD2, digital micromirror devices; M1 and M2, mirrors; OL1 and OL2, objective lenses; and BS, beam splitter. (b) (i)–(iii) are the raw interferograms under three different illumination angles, and (iv)–(vi) are their corresponding spatial spectra.
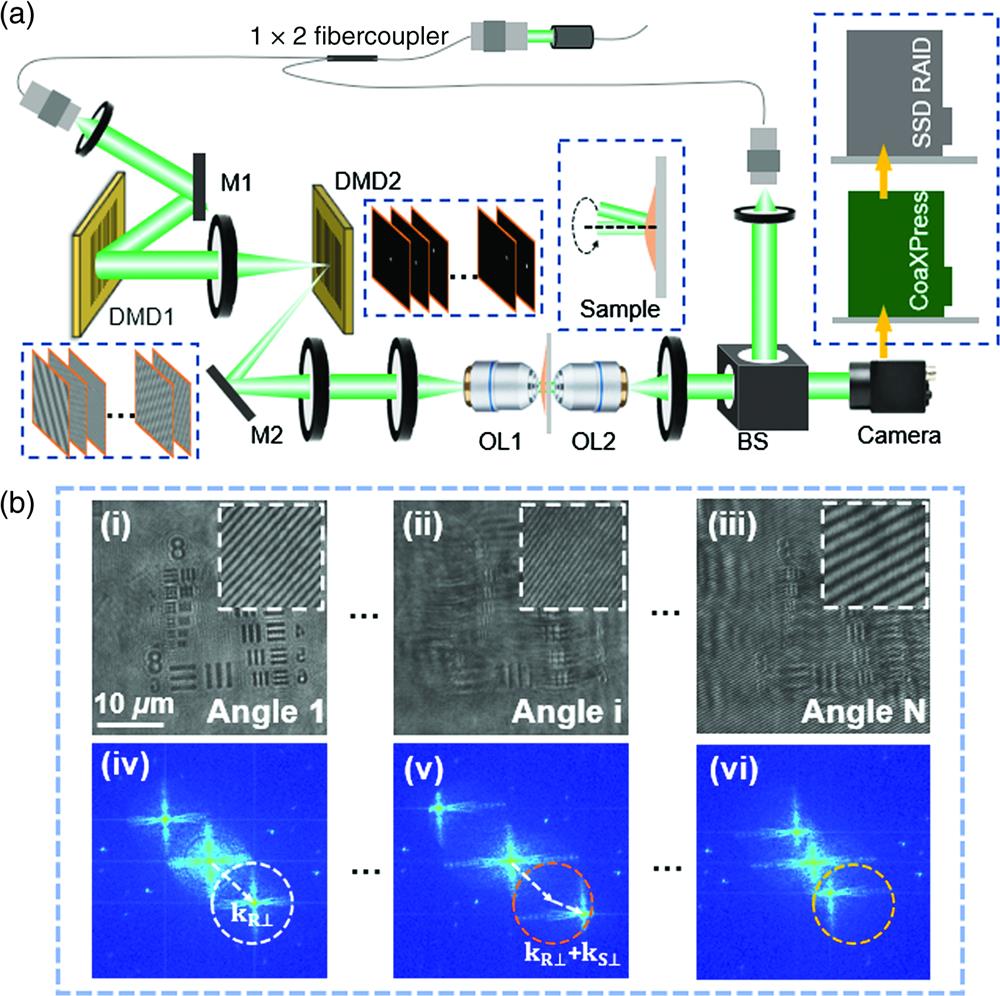
    Fig. 1. (a) Schematic of the HISTR-SAPM setup. DMD1 and DMD2, digital micromirror devices; M1 and M2, mirrors; OL1 and OL2, objective lenses; and BS, beam splitter. (b) (i)–(iii) are the raw interferograms under three different illumination angles, and (iv)–(vi) are their corresponding spatial spectra.
    (a) The spatial spectrum synthesis process in HISTR-SAPM. The dotted circles correspond to the frequency passband in Fig. 1(b). (b), (c) High-resolution amplitude and phase reconstruction, respectively.
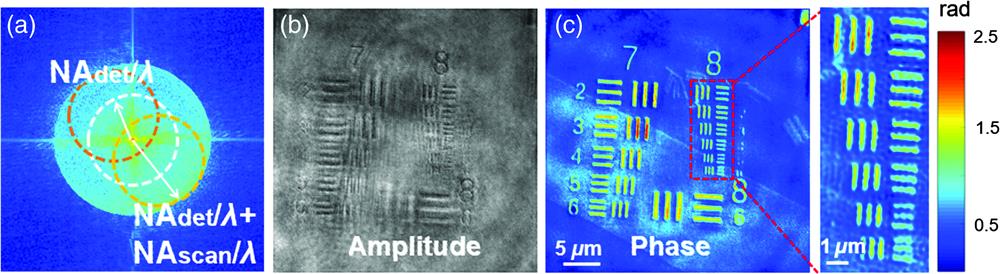
    Fig. 2. (a) The spatial spectrum synthesis process in HISTR-SAPM. The dotted circles correspond to the frequency passband in Fig. 1(b). (b), (c) High-resolution amplitude and phase reconstruction, respectively.
    Imaging of a custom-made subwavelength grating structure: (a) the original design of the structure; (b) a portion of the structure imaged under SEM; (c) the height map retrieved using conventional QPM; (d) the height map reconstructed using HISTR-SAPM; and (e) the line profiles along the white lines in (b) and (d).
    Fig. 3. Imaging of a custom-made subwavelength grating structure: (a) the original design of the structure; (b) a portion of the structure imaged under SEM; (c) the height map retrieved using conventional QPM; (d) the height map reconstructed using HISTR-SAPM; and (e) the line profiles along the white lines in (b) and (d).
    RBC membrane height fluctuation over a time period of 1 s (Video S1): (A) cell center region; (B) cell outer region; and (C) background region. Time-lapse video of RBC membrane fluctuation (Video S1, MP4, 5.87 MB [URL: https://doi.org/10.1117/1.AP.2.6.065002.1]).
    Fig. 4. RBC membrane height fluctuation over a time period of 1 s (Video S1): (A) cell center region; (B) cell outer region; and (C) background region. Time-lapse video of RBC membrane fluctuation (Video S1, MP4, 5.87 MB [URL: https://doi.org/10.1117/1.AP.2.6.065002.1]).
    Observation of subcellular structures in unlabeled living cells: (a), (d) the phase maps of a COS-7 and a HeLa cell under normal illumination; (b), (e) the phase maps reconstructed with HISTR-SAPM for the cells in (a), (d); and (c), (f) the phase gradient maps obtained from (b), (e).
    Fig. 5. Observation of subcellular structures in unlabeled living cells: (a), (d) the phase maps of a COS-7 and a HeLa cell under normal illumination; (b), (e) the phase maps reconstructed with HISTR-SAPM for the cells in (a), (d); and (c), (f) the phase gradient maps obtained from (b), (e).
    Observation of living 3T3 cell dynamics after exposure to acetic acid (Video S2). (a)–(c) The representative phase map frames reconstructed with HISTR-SAPM for the 3T3 cell during exposure to acetic acid. (d) The time-lapse curves showing phase evolution in the nucleus, cytoplasm, and background over time. Time-lapse video of 3T3 cell dynamics after exposure to acetic acid (Video S2, MP4, 6.19 MB [URL: https://doi.org/10.1117/1.AP.2.6.065002.2]).
    Fig. 6. Observation of living 3T3 cell dynamics after exposure to acetic acid (Video S2). (a)–(c) The representative phase map frames reconstructed with HISTR-SAPM for the 3T3 cell during exposure to acetic acid. (d) The time-lapse curves showing phase evolution in the nucleus, cytoplasm, and background over time. Time-lapse video of 3T3 cell dynamics after exposure to acetic acid (Video S2, MP4, 6.19 MB [URL: https://doi.org/10.1117/1.AP.2.6.065002.2]).
    Cheng Zheng, Di Jin, Yanping He, Hongtao Lin, Juejun Hu, Zahid Yaqoob, Peter T. C. So, Renjie Zhou. High spatial and temporal resolution synthetic aperture phase microscopy[J]. Advanced Photonics, 2020, 2(6): 065002
    Download Citation