
Rundong Fan, Huifu Zhao, Yi Zeng, Wenju Duan, Ying Hao. Design of Small Distortion Projection System Based on Double Gaussian Structure and Freeform Surface Illumination[J]. Laser & Optoelectronics Progress, 2021, 58(23): 2322001
- Laser & Optoelectronics Progress
- Vol. 58, Issue 23, 2322001 (2021)
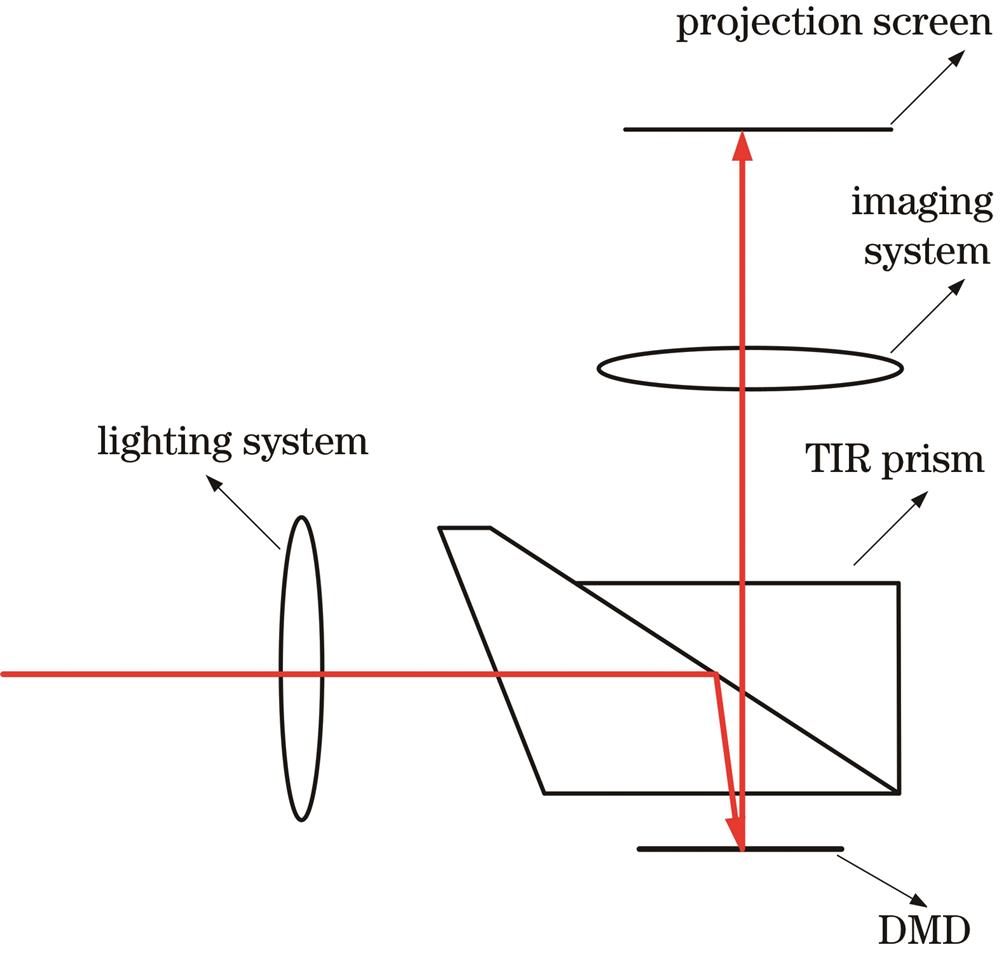
Fig. 1. Schematic of overall system structure
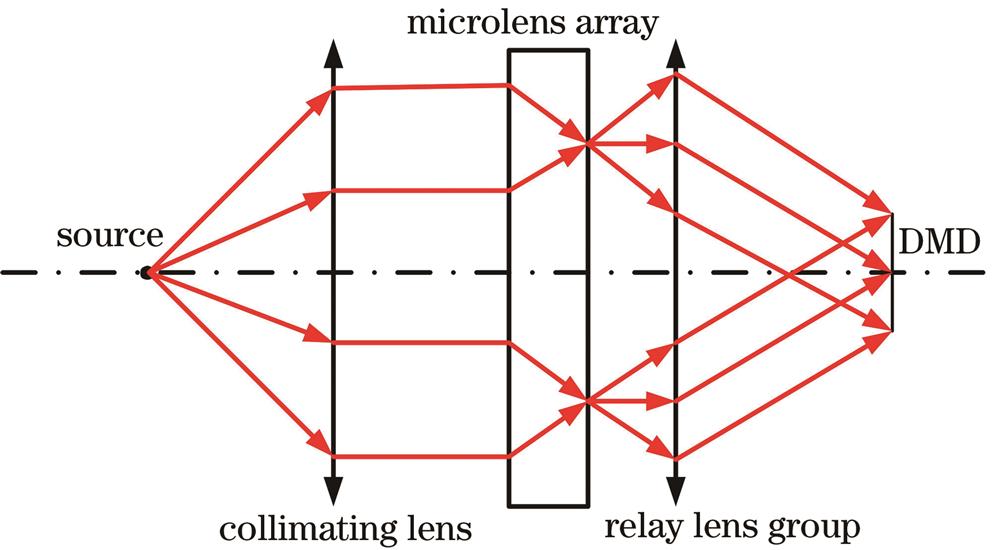
Fig. 2. Schematic of lighting lightpath
Fig. 3. Schematic of analysis principle of collimating lens
Fig. 4. Design of microlens array. (a) Schematic of design principle of microlens; (b) schematic of ray tracing of microlens array
Fig. 5. Structure diagram of lighting system
Fig. 6. Output light intensity curves of collimating lens
Fig. 7. Illumination of target surface in lighting system. (a) Schematic of plane distribution; (b) schematic of distribution curve
Fig. 8. Schematic of inverse telephoto principle
Fig. 9. Initial structure of double Gaussian imaging system
Fig. 10. Field curvature and distortion of double Gaussian structure after focal length scaling
Fig. 11. Half structure of double Gaussian structure
Fig. 12. Point plot and field distortion of 35° field. (a) Point plot; (b) field distortion
Fig. 13. Diagram of ray tracing
Fig. 14. Image quality results. (a) Transfer function diagram; (b) field curvature and distortion; (c) mesh distortion; (d) vertical axis chromatic aberration
|
Table 1. Relevant parameters and design indicators of projection system
| |||||||||||||||||||||||||||||||||||||||||||||||||||||||
Table 2. Production and adjustment indicators that have a great impact on system
|
Table 3. Analysis results of Monte Carlo algorithm

Set citation alerts for the article
Please enter your email address
© Copyright 2018-2021 | Chinese Laser Press. All Rights Reserved 沪ICP备15018463号-20