• Photonics Research
  • Vol. 6, Issue 5, 451 (2018)
Jinwen Wang, Xin Yang, Yunke Li, Yun Chen, Mingtao Cao, Dong Wei, Hong Gao*, and Fuli Li
Author Affiliations
  • Shaanxi Key Laboratory of Quantum Information and Quantum Optoelectronic Devices, School of Science, Xi’an Jiaotong University, Xi’an 710049, China
  • show less
    DOI: 10.1364/PRJ.6.000451 Cite this Article Set citation alerts
    Jinwen Wang, Xin Yang, Yunke Li, Yun Chen, Mingtao Cao, Dong Wei, Hong Gao, Fuli Li. Optically spatial information selection with hybridly polarized beam in atomic vapor[J]. Photonics Research, 2018, 6(5): 451 Copy Citation Text show less
    Experimental setup. QWP, quarter-wave plate; HWP, half-wave plate; M, mirror; PBS, polarization beam splitter; BS, beam splitter; SMF, single mode fiber; PD, photodetector; SLM, spatial light modulator; CCD, charge-coupled device camera. (a) Diagram of polarization selection experiment. (b) Diagram of Stokes parameters measurement.
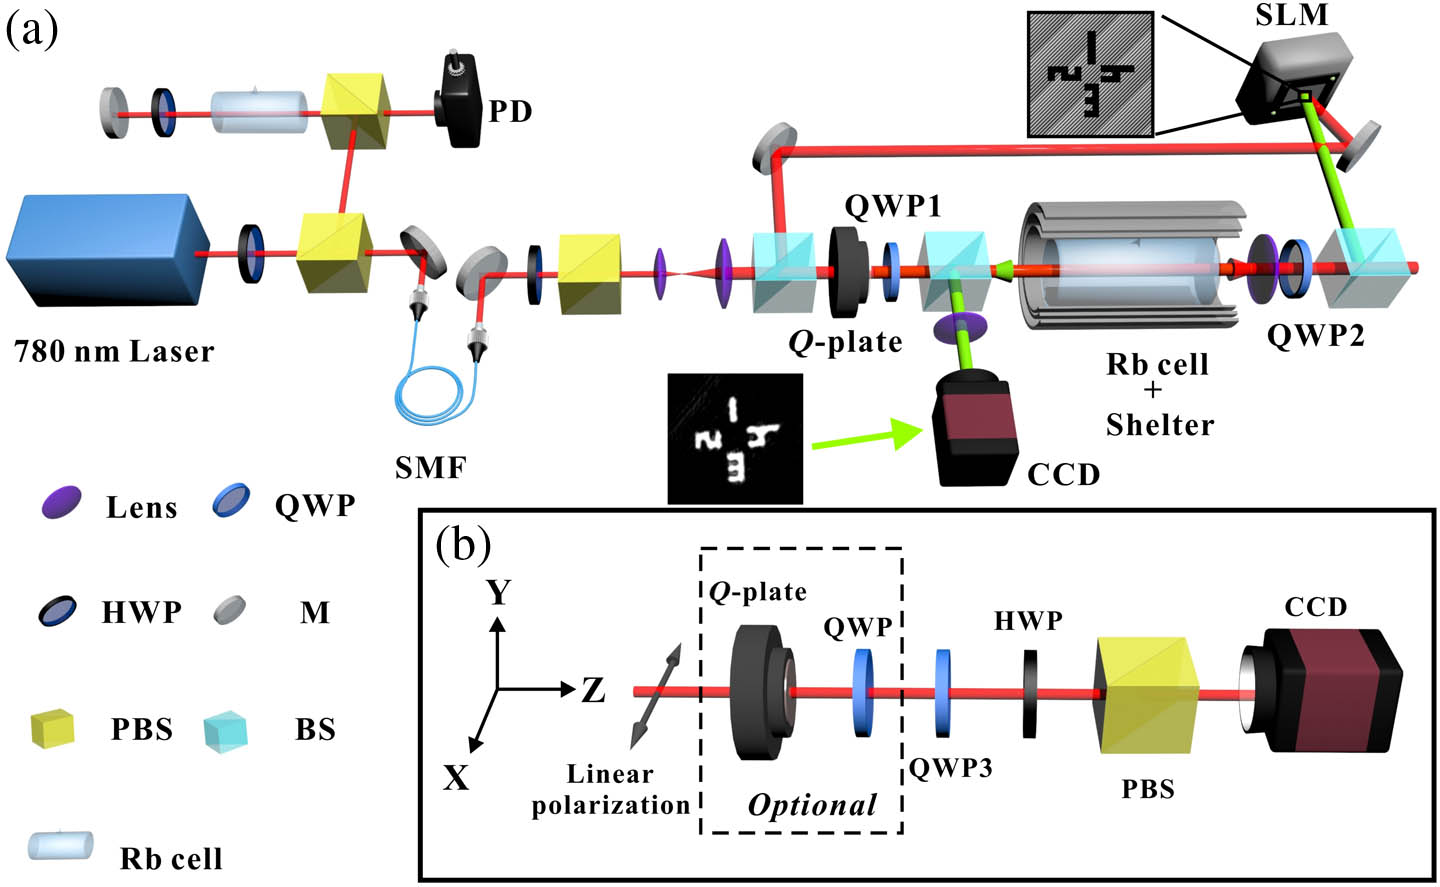
    Fig. 1. Experimental setup. QWP, quarter-wave plate; HWP, half-wave plate; M, mirror; PBS, polarization beam splitter; BS, beam splitter; SMF, single mode fiber; PD, photodetector; SLM, spatial light modulator; CCD, charge-coupled device camera. (a) Diagram of polarization selection experiment. (b) Diagram of Stokes parameters measurement.
    Experimental results of Stokes parameters measurement. Top to bottom row: circularly polarized beam, radially polarized beam, and hybridly polarized beam, respectively. Arrowed lines inside the first column figures indicate the polarization states.
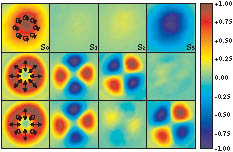
    Fig. 2. Experimental results of Stokes parameters measurement. Top to bottom row: circularly polarized beam, radially polarized beam, and hybridly polarized beam, respectively. Arrowed lines inside the first column figures indicate the polarization states.
    Experimental results of polarization selection transparency. (a)–(d) Two-lobe pattern exits at the position where the polarization of the coupling beam is orthogonal to the probe beam. (e)–(h) Spatial information after filtrating. The fast axis rotation angles of QWP1 are 0°, 45°, 90°, and 135°, with respect to the horizontal direction. Yellow dashed line in figure corresponds with the fast axis direction of QWP1. (i) Diagram for selecting azimuthal angle. (j) Normalized intensity of azimuthal distribution.
    Fig. 3. Experimental results of polarization selection transparency. (a)–(d) Two-lobe pattern exits at the position where the polarization of the coupling beam is orthogonal to the probe beam. (e)–(h) Spatial information after filtrating. The fast axis rotation angles of QWP1 are 0°, 45°, 90°, and 135°, with respect to the horizontal direction. Yellow dashed line in figure corresponds with the fast axis direction of QWP1. (i) Diagram for selecting azimuthal angle. (j) Normalized intensity of azimuthal distribution.
    (a) Hyperfine-energy level diagram of the D2 line of Rb87 atoms. Degenerate energy level diagram for Fg=1 to Fe=0 and Fe=1 in D2 line of Rb87 atoms on the right side. Red: coupling beam; green: probe beam. (b) σ− for probe and σ− for coupling. (c) σ− for probe and σ+ for coupling. (d) σ+ for probe and σ− for coupling. (e) σ+ for probe and σ+ for coupling.
    Fig. 4. (a) Hyperfine-energy level diagram of the D2 line of Rb87 atoms. Degenerate energy level diagram for Fg=1 to Fe=0 and Fe=1 in D2 line of Rb87 atoms on the right side. Red: coupling beam; green: probe beam. (b) σ for probe and σ for coupling. (c) σ for probe and σ+ for coupling. (d) σ+ for probe and σ for coupling. (e) σ+ for probe and σ+ for coupling.
    Experimental setup and results of spectrum measurement. (a) Diagram of experiment. (b) Polarization state of probe beam is σ−. (c) Polarization state of probe beam is σ+. Different color curves represent the different coupling beam polarization states. Red (curve): −45° (the fast axis rotation angle of QWP1 corresponding to the horizontal direction); orange: −30°; green: −15°; light cyan: 0°; violet: +15°; blue: +30°; dark yellow: +45°. (d), (e) Intensity variations corresponding to the laser locked in the X01 against rotation angle in (b) and (c), respectively.
    Fig. 5. Experimental setup and results of spectrum measurement. (a) Diagram of experiment. (b) Polarization state of probe beam is σ. (c) Polarization state of probe beam is σ+. Different color curves represent the different coupling beam polarization states. Red (curve): 45° (the fast axis rotation angle of QWP1 corresponding to the horizontal direction); orange: 30°; green: 15°; light cyan: 0°; violet: +15°; blue: +30°; dark yellow: +45°. (d), (e) Intensity variations corresponding to the laser locked in the X01 against rotation angle in (b) and (c), respectively.
    Jinwen Wang, Xin Yang, Yunke Li, Yun Chen, Mingtao Cao, Dong Wei, Hong Gao, Fuli Li. Optically spatial information selection with hybridly polarized beam in atomic vapor[J]. Photonics Research, 2018, 6(5): 451
    Download Citation