• Spectroscopy and Spectral Analysis
  • Vol. 42, Issue 6, 1832 (2022)
Shu-jie LI1、*, Jie LIU1、1;, Zi-ang DENG1、1;, Quan-hong OU1、1;, You-ming SHI2、2;, and Gang LIU1、1; *;
Author Affiliations
  • 11. School of Physics and Electronic Information, Yunnan Normal University, Kunming 650500, China
  • 22. School of Physics and Electronic Engineering, Qujing Normal University, Qujing 655011, China
  • show less
    DOI: 10.3964/j.issn.1000-0593(2022)06-1832-09 Cite this Article
    Shu-jie LI, Jie LIU, Zi-ang DENG, Quan-hong OU, You-ming SHI, Gang LIU. Study of Germinated Rice Seeds by FTIR Spectroscopy Combined With Curve Fitting[J]. Spectroscopy and Spectral Analysis, 2022, 42(6): 1832 Copy Citation Text show less
    FTIR spectra of rice seeds on different germination daysa: 0 d; b: 2 d; c: 4 d; d: 6 d; e: 8 d; f: 10 d; g: 12 d; h: 14 d
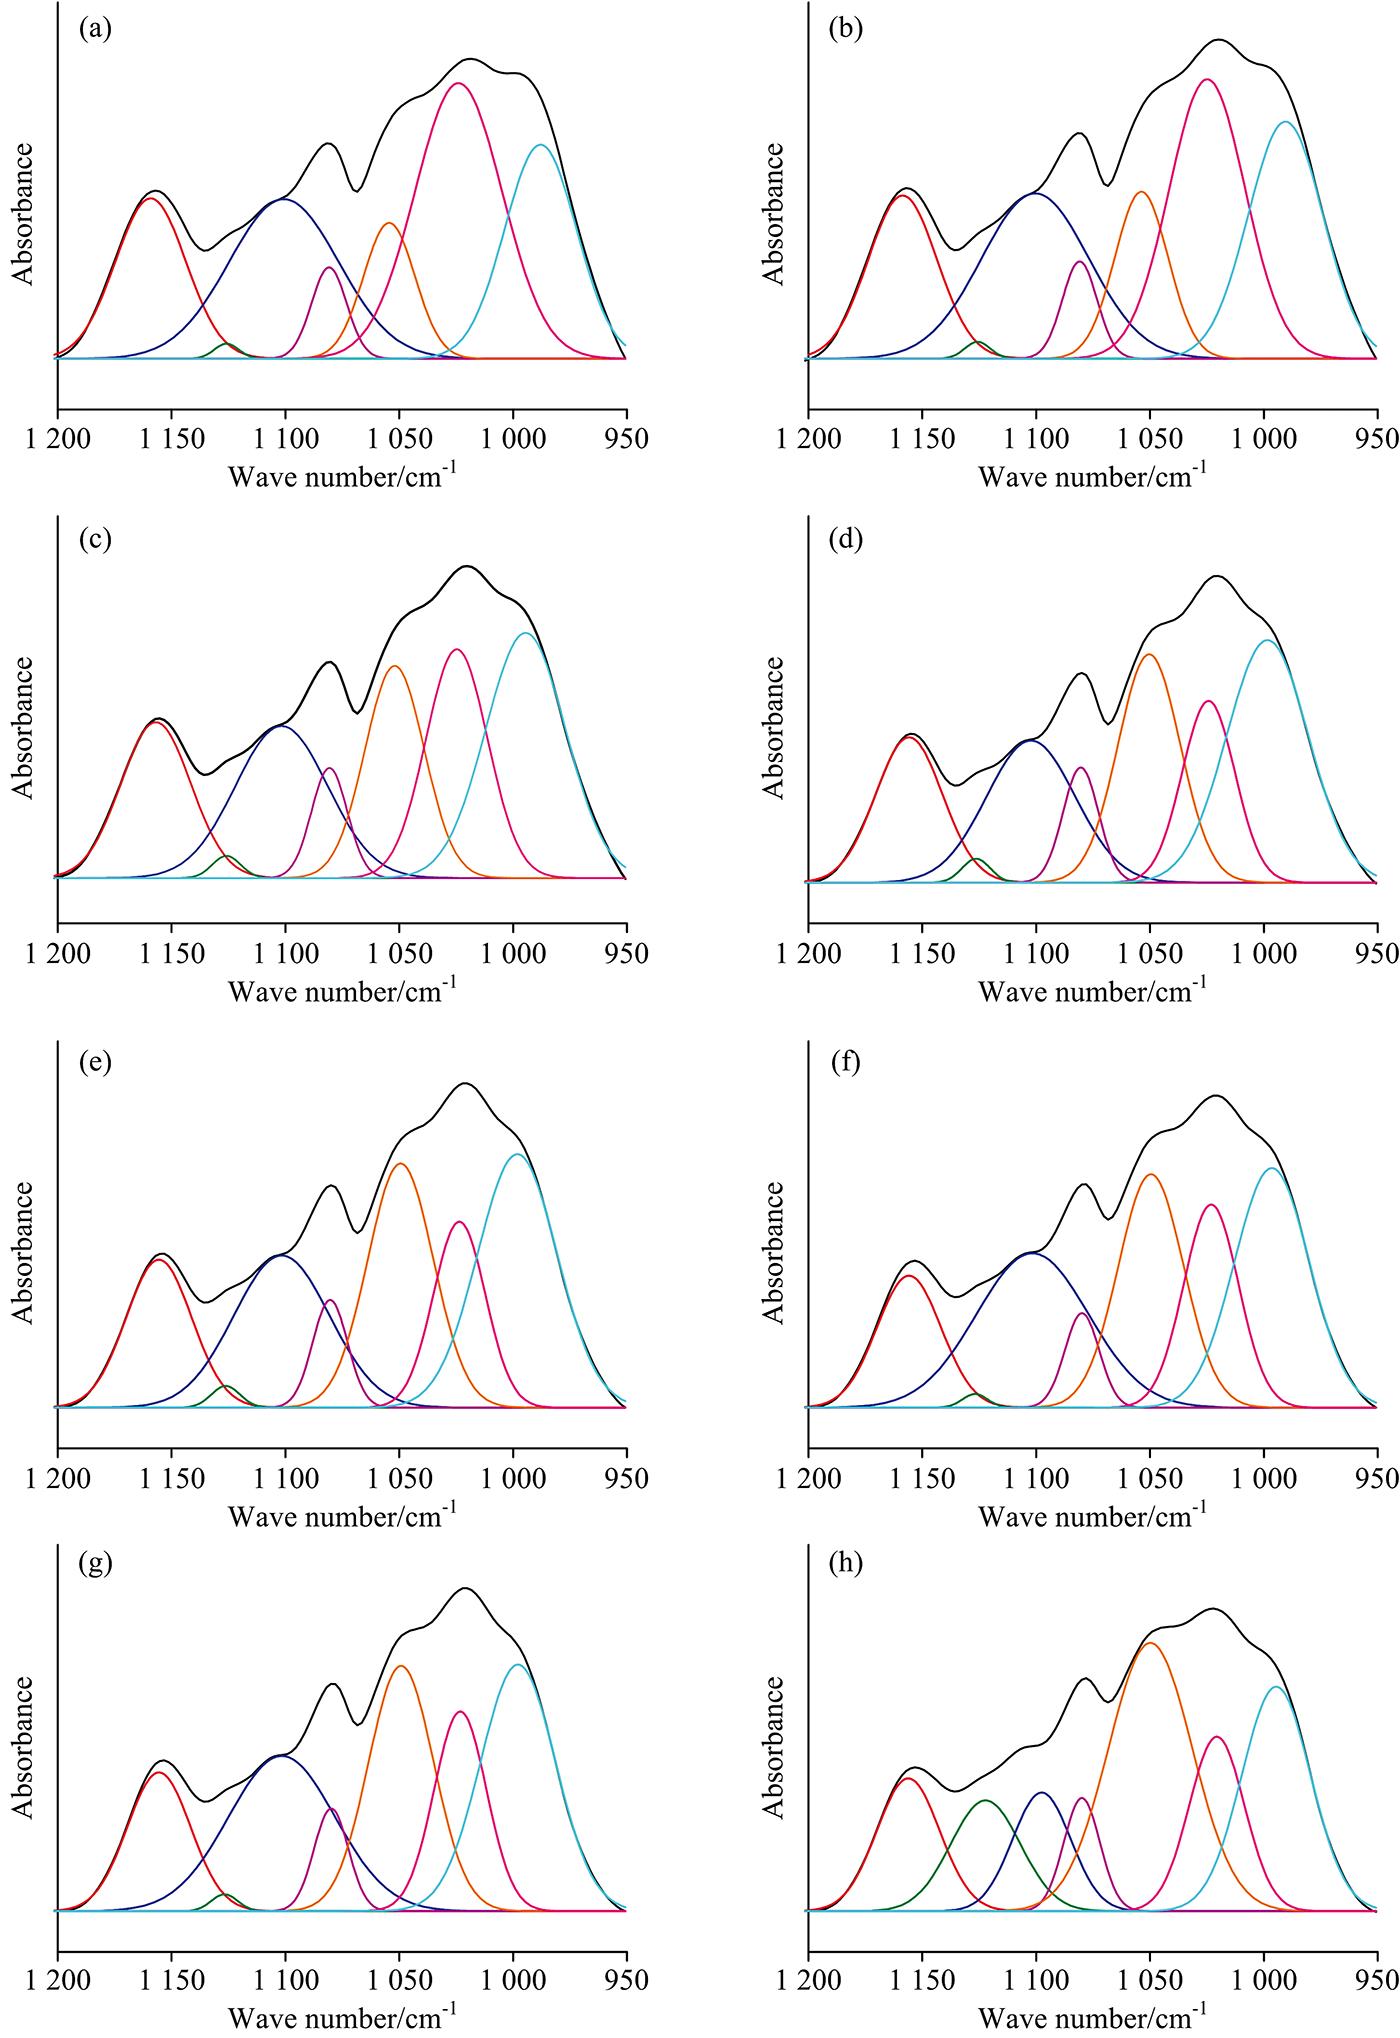
    Fig. 1. FTIR spectra of rice seeds on different germination days
    a: 0 d; b: 2 d; c: 4 d; d: 6 d; e: 8 d; f: 10 d; g: 12 d; h: 14 d
    Curve fitting maps of infrared spectra of rice seeds on different germination days in the range of 1 200~950 cm-1(a): 0 d; (b): 2 d; (c): 4 d; (d): 6 d; (e): 8 d; (f): 10 d; (g): 12 d; (h): 14 d
    Fig. 1. Curve fitting maps of infrared spectra of rice seeds on different germination days in the range of 1 200~950 cm-1
    (a): 0 d; (b): 2 d; (c): 4 d; (d): 6 d; (e): 8 d; (f): 10 d; (g): 12 d; (h): 14 d
    Curve fitting maps of infrared spectra of rice seeds on different germination days in the range of 1 800~1 600 cm-1(a): 0 d; (b): 2 d; (c): 4 d; (d): 6 d; (e): 8 d; (f): 10 d; (g): 12 d; (h): 14 d
    Fig. 2. Curve fitting maps of infrared spectra of rice seeds on different germination days in the range of 1 800~1 600 cm-1
    (a): 0 d; (b): 2 d; (c): 4 d; (d): 6 d; (e): 8 d; (f): 10 d; (g): 12 d; (h): 14 d
    Absorption peak intensity ratios of rice seeds on different germination days
    Fig. 2. Absorption peak intensity ratios of rice seeds on different germination days
    Two-dimensional correlation infrared spectra of rice seeds on different germination days in the range of 814~1 000 cm-1(a): 0 d; (b): 2 d; (c): 4 d; (d): 6 d; (e): 8 d; (f): 10 d; (g): 12 d; (h): 14 d
    Fig. 3. Two-dimensional correlation infrared spectra of rice seeds on different germination days in the range of 814~1 000 cm-1
    (a): 0 d; (b): 2 d; (c): 4 d; (d): 6 d; (e): 8 d; (f): 10 d; (g): 12 d; (h): 14 d
    Two-dimensional correlation infrared spectra of rice seeds on different germination days in the range of 1 028~1 340 cm-1(a): 0 d; (b): 2 d; (c): 4 d; (d): 6 d; (e): 8 d; (f): 10 d; (g): 12 d; (h): 14 d
    Fig. 4. Two-dimensional correlation infrared spectra of rice seeds on different germination days in the range of 1 028~1 340 cm-1
    (a): 0 d; (b): 2 d; (c): 4 d; (d): 6 d; (e): 8 d; (f): 10 d; (g): 12 d; (h): 14 d
    Second derivative spectra (a) and curve fitting spectra (b) of rice seeds in the range of 1 200~950 cm-1
    Fig. 5. Second derivative spectra (a) and curve fitting spectra (b) of rice seeds in the range of 1 200~950 cm-1
    Second derivative spectra (a) and curve fitting spectra of rice seeds (b) in the range of 1 800~1 600 cm-1
    Fig. 6. Second derivative spectra (a) and curve fitting spectra of rice seeds (b) in the range of 1 800~1 600 cm-1
    萌发
    时间/d
    自动峰
    数目
    最强自动
    峰/cm-1
    次强峰
    /cm-1
    弱自动
    峰/cm-1
    03875834, 905-
    24883901, 961834
    45883901, 950, 966834
    64883874, 907834
    84974883, 908837
    103974908840
    123975908843
    144975884, 908834
    Table 1. Auto-peaks of two-dimensional correlation infrared spectra of rice seeds at different germination times in the range of 814~1 000 cm-1
    萌发
    时间
    /d
    自动
    峰数
    最强
    自动峰
    /cm-1
    次强峰/cm-1弱自动峰/cm-1
    081 2291 138, 1 198,
    1 067, 1 259
    1 037, 1 098,
    1 118
    271 0671 138, 1 228,
    1 198
    1 037, 1 097,
    1 276
    481 2271 067, 1 138,
    1 189, 1 269
    1 038, 1 098,
    1 118
    681 0671 138, 1 198,
    1 227
    1 037, 1 097,
    1 118, 1 278
    871 0671 138, 1 198,
    1 223
    1 038, 1 097,
    1 287
    1071 0671 138, 1 198,
    1 227
    1 038, 1 097,
    1 287
    1261 0671 138, 1 198,
    1 218
    1 038, 1 097
    1471 0671 138, 1 198,
    1 219
    1 037, 1 097,
    1 299
    Table 2. Auto-peaks of two-dimensional correlation infrared spectra of rice seeds at different germination times in the range of 1 028~1 340 cm-1
    No0 d2 d4 d6 d
    ν/cm-1Area/%ν/cm-1Area/%ν/cm-1Area/%ν/cm-1Area/%
    11 02030.46±0.211 02025.69±1.751 02018.77±0.951 02012.71±1.20
    21 0538.89±0.121 05311.81±1.011 05216.38±0.691 05120.60±0.74
    31 64114.04±1.101 64014.19±2.141 64212.17±3.321 64013.86±1.25
    41 69223.12±2.161 69215.59±8.061 69021.76±3.961 6944.10±2.89
    51 74416.86±0.971 74417.14±1.081 74413.20±0.201 74410.41±2.46
    No8 d10 d12 d14 d
    ν/cm-1Area/%ν/cm-1Area/%ν/cm-1Area/%ν/cm-1Area/%
    11 02113.72±0.751 02015.21±0.361 02014.14±0.221 02012.10±0.58
    21 05121.12±0.391 05120.59±0.311 05121.47±0.251 05130.88±0.74
    31 63921.11±2.191 62715.73±2.111 63916.26±2.381 63714.24±1.77
    41 6909.23±2.921 6926.64±2.281 6903.69±1.791 6893.52±1.54
    51 7449.05±1.461 74413.08±0.181 74413.38±0.471 74420.27±3.61
    Table 3. Percentage of characteristic peak area of rice seeds on different germination days
    Shu-jie LI, Jie LIU, Zi-ang DENG, Quan-hong OU, You-ming SHI, Gang LIU. Study of Germinated Rice Seeds by FTIR Spectroscopy Combined With Curve Fitting[J]. Spectroscopy and Spectral Analysis, 2022, 42(6): 1832
    Download Citation