
Qian Zhang, Anguo Dong, Rui Song. Hyperspectral Image Classification Based on Multiple Features and an Improved Autoencoder[J]. Laser & Optoelectronics Progress, 2020, 57(8): 081010
- Laser & Optoelectronics Progress
- Vol. 57, Issue 8, 081010 (2020)
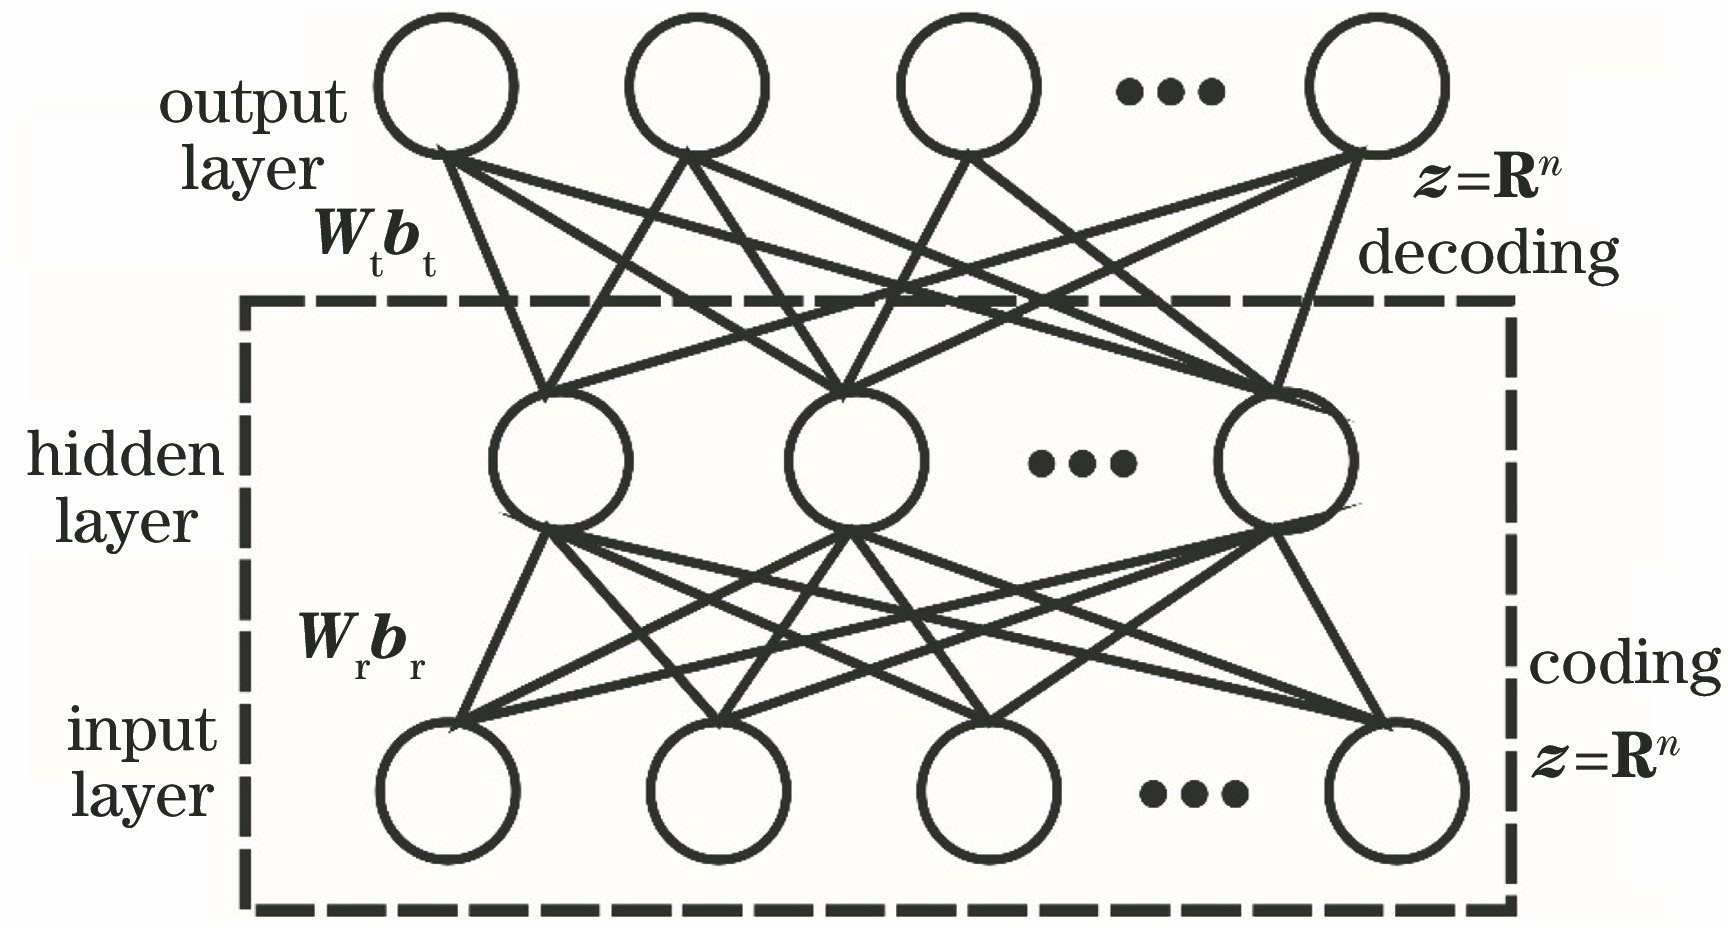
Fig. 1. Autoencoder network structure
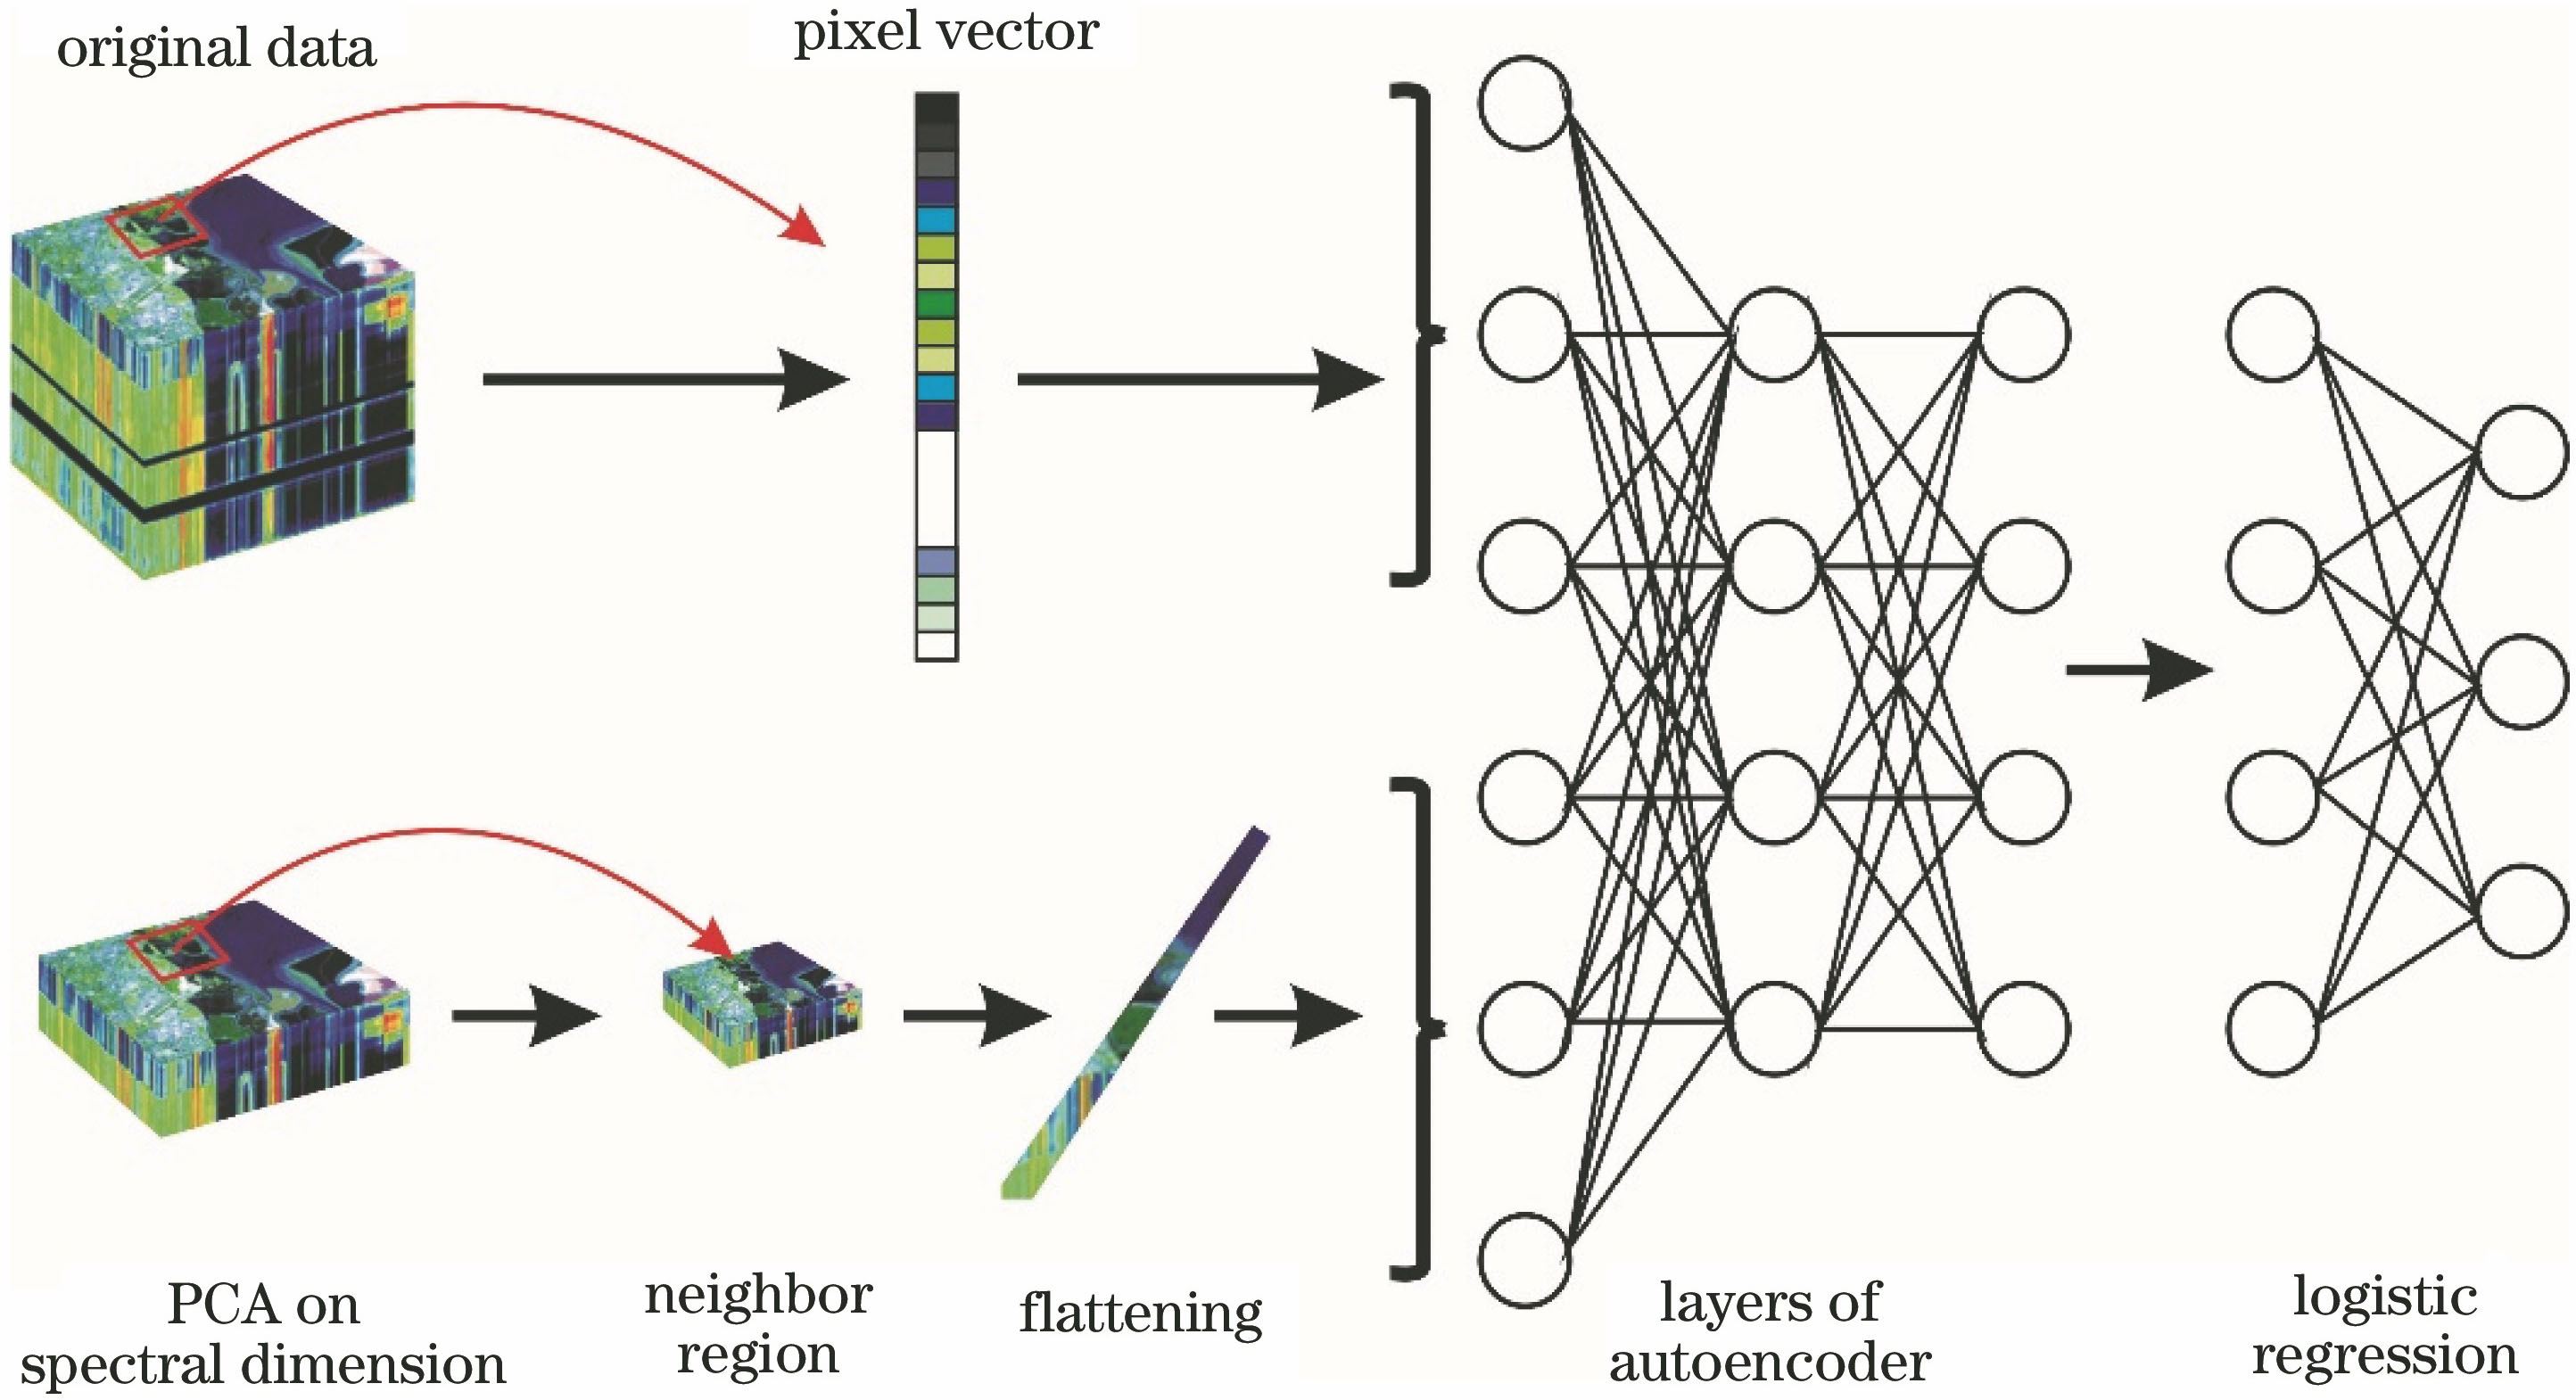
Fig. 2. SSAE algorithm model diagram
Fig. 3. Comparison of PCA and LargeVis algorithm. (a) PCA-Indian pines; (b) PCA-Pavia U; (c) LargeVis-Indian pines; (d) LargeVis-Pavia U
Fig. 4. EAP structure diagram
Fig. 5. Batch-mode active learning sampling strategy flow chart
Fig. 6. MF-AL-SSAE algorithm model diagram
Fig. 7. Classification renderings of six algorithms on the Indian pines dataset. (a) Original image; (b) real ground; (c) SSAE algorithm; (d) SVM algorithm; (e) CK-SVM algorithm; (f) CLBP-SSAE algorithm; (g) EMAP-SSAE algorithm; (h) MF-AL-SSAE algorithm
Fig. 8. Classification renderings of six algorithms on the Pavia U dataset. (a) Original image; (b) real ground; (c) SSAE algorithm; (d) SVM algorithm; (e) CK-SVM algorithm; (f) CLBP-SSAE algorithm; (g) EMAP-SSAE algorithm; (h) MF-AL-SSAE algorithm
Fig. 9. Variation in OA of different datasets with the number of training samples. (a) Indian pines; (b) Pavia U
| |||||||||||||||||||||||||||||||||||||||||||||||||||||||||||||||||||||||||||||||||||||||||||||||||||||||||||||||||||||||||||||||||||||||||||||||||||||||||||||||||||||||||||||||||||
Table 1. Experimental data and classification accuracies of the Indian pines dataset
| ||||||||||||||||||||||||||||||||||||||||||||||||||||||||||||||||||||||||||||||||||||||||||||||||||||||||||||||||||||
Table 2. Experimental data and classification accuracies of the Pavia U dataset

Set citation alerts for the article
Please enter your email address
© Copyright 2018-2021 | Chinese Laser Press. All Rights Reserved 沪ICP备15018463号-20