• Laser & Optoelectronics Progress
  • Vol. 56, Issue 1, 010301 (2019)
Le Luo1, Qian Chen1, Xingjiong Liu1, Yiyun Yan1, Guohua Gu1, Weiji He1、*, and Ya Wang2
Author Affiliations
  • 1 School of Electronic Engineering and Optoelectronics, Nanjing University of Science and Technology, Nanjing, Jiangsu 210094, China
  • 2 Department of Basic Science of Taizhou Institute of Science and Technology, Nanjing University of Science and Technology, Taizhou, Jiangsu 225300, China
  • show less
    DOI: 10.3788/LOP56.010301 Cite this Article Set citation alerts
    Le Luo, Qian Chen, Xingjiong Liu, Yiyun Yan, Guohua Gu, Weiji He, Ya Wang. Colored Adaptive Compressed Imaging Based on Extended Wavelet Trees[J]. Laser & Optoelectronics Progress, 2019, 56(1): 010301 Copy Citation Text show less
    Structure of extended wavelet trees
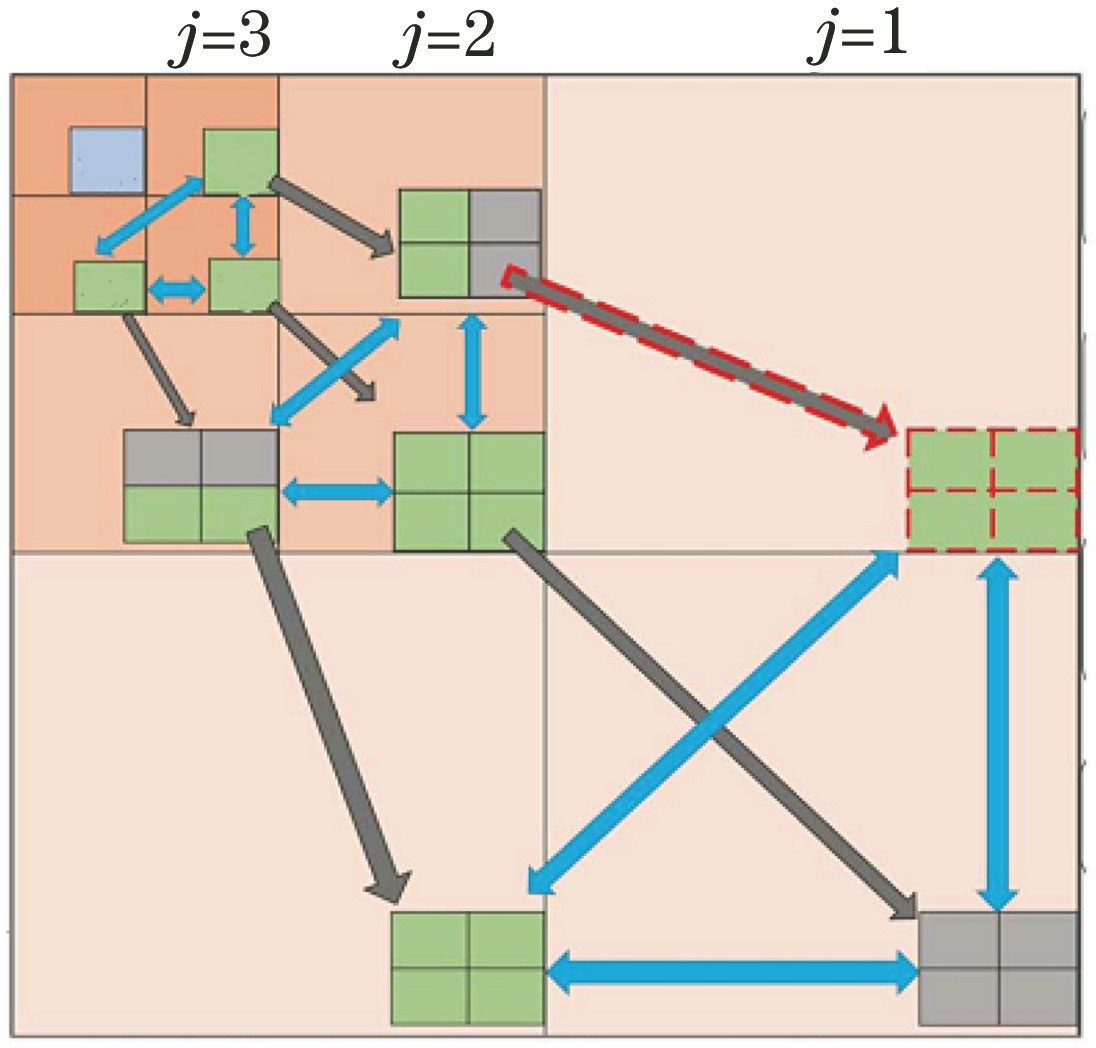
    Fig. 1. Structure of extended wavelet trees
    Sparse representation of images in Haar wavelet
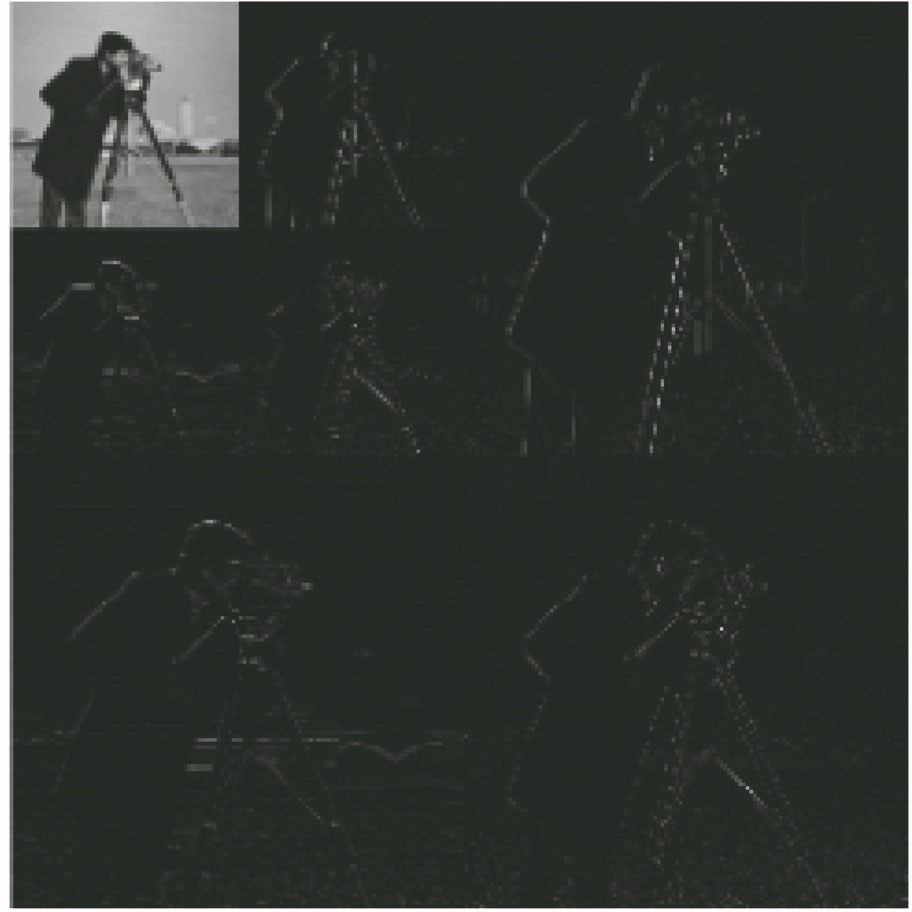
    Fig. 2. Sparse representation of images in Haar wavelet
    Color image baboon and its three component images. (a) Original image; (b) red; (c) green; (d) blue
    Fig. 3. Color image baboon and its three component images. (a) Original image; (b) red; (c) green; (d) blue
    Locations of significant wavelet coefficients of different directions in three channels at the first scale
    Fig. 4. Locations of significant wavelet coefficients of different directions in three channels at the first scale
    Result after wavelet inverse transform. (a) Original baboon image; (b) reconstructed baboon image
    Fig. 5. Result after wavelet inverse transform. (a) Original baboon image; (b) reconstructed baboon image
    Reconstructed results of three models at different sampling times. (a) 400; (b) 500; (c) 600; (d) 700; (e) 800; (f) 900; (g) 1000
    Fig. 6. Reconstructed results of three models at different sampling times. (a) 400; (b) 500; (c) 600; (d) 700; (e) 800; (f) 900; (g) 1000
    Zoomed reconstructed results of three models at different sampling times. (a) 600; (b) 700; (c) 800; (d) 900; (e) 1000
    Fig. 7. Zoomed reconstructed results of three models at different sampling times. (a) 600; (b) 700; (c) 800; (d) 900; (e) 1000
    X-Rite standard color chart
    Fig. 8. X-Rite standard color chart
    Experimental setup of colored adaptive compressed imaging method
    Fig. 9. Experimental setup of colored adaptive compressed imaging method
    Reconstructed images of color chart at different sampling times using multi-mask Bayesian Model. (a) Un-sampled; (b) 400; (c) 600; (d) 800; (e) 1000
    Fig. 10. Reconstructed images of color chart at different sampling times using multi-mask Bayesian Model. (a) Un-sampled; (b) 400; (c) 600; (d) 800; (e) 1000
    MethodSampling times
    4005006007008009001000
    TVAL313.9714.3715.1114.4816.1916.8616.01
    Separatemodel26.5027.0828.6327.1226.1026.6227.10
    Multitaskmodel26.6226.6426.9227.3827.9227.3028.11
    Table 1. PSNR values of different models
    MethodSampling times
    4006007008009001000
    Separatemodel20.9515.7913.6014.3414.4616.05
    Multitaskmodel15.4414.4914.9615.3515.4316.20
    Table 2. Mean values of ΔE00 in two models
    MethodSampling times
    4006007008009001000
    Separatemodel37.8327.6528.6221.5421.5235.38
    Multitaskmodel22.4226.1520.7723.2122.1322.94
    Table 3. Maximum values of ΔE00 in two models
    Le Luo, Qian Chen, Xingjiong Liu, Yiyun Yan, Guohua Gu, Weiji He, Ya Wang. Colored Adaptive Compressed Imaging Based on Extended Wavelet Trees[J]. Laser & Optoelectronics Progress, 2019, 56(1): 010301
    Download Citation