• Laser & Optoelectronics Progress
  • Vol. 59, Issue 4, 0417003 (2022)
Guogang Cao1、*, Hongdong Mao1, Shu Zhang1, Ying Chen1, and Cuixia Dai2
Author Affiliations
  • 1School of Computer Science and Information Engineering, Shanghai Institute of Technology, Shanghai 201418, China
  • 2College of Sciences, Shanghai Institute of Technology, Shanghai 201418, China
  • show less
    DOI: 10.3788/LOP202259.0417003 Cite this Article Set citation alerts
    Guogang Cao, Hongdong Mao, Shu Zhang, Ying Chen, Cuixia Dai. SAU-Net: Multiorgan Image Segmentation Method Improved Using Squeeze Attention Mechanism[J]. Laser & Optoelectronics Progress, 2022, 59(4): 0417003 Copy Citation Text show less
    Architecture of SAU-Net
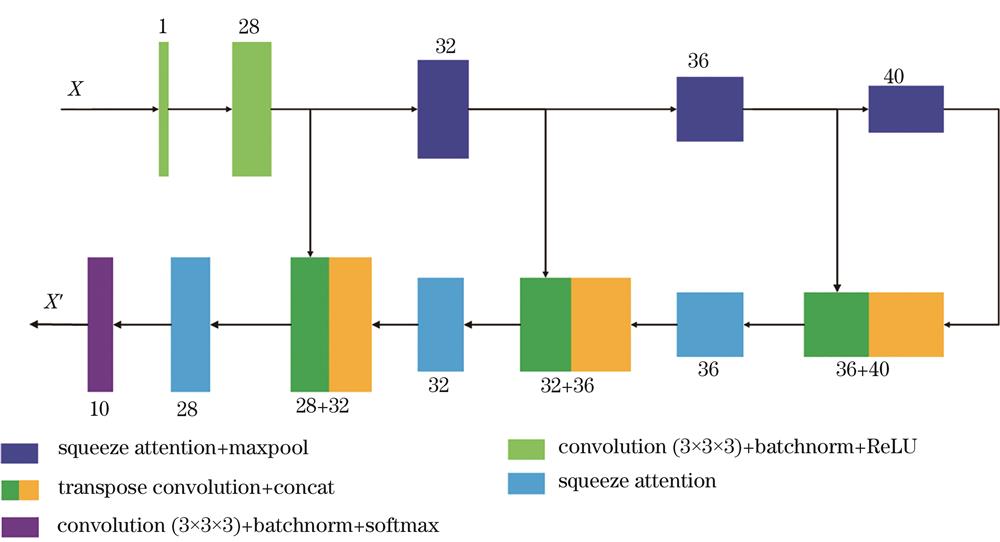
    Fig. 1. Architecture of SAU-Net
    Architecture of squeeze attention module
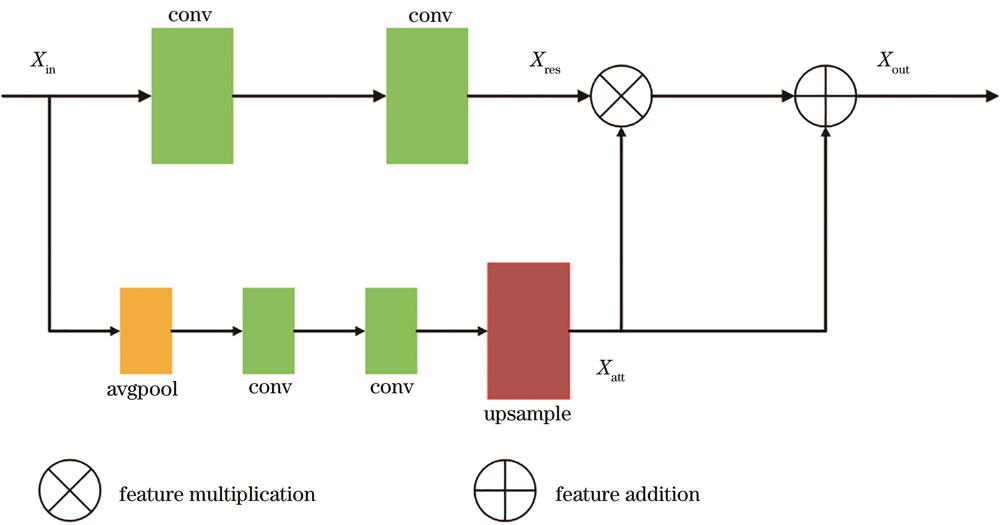
    Fig. 2. Architecture of squeeze attention module
    Number of voxels in each organ of head and neck CT images
    Fig. 3. Number of voxels in each organ of head and neck CT images
    Number of annotated organs in training dataset
    Fig. 4. Number of annotated organs in training dataset
    Comparison of loss value curves of different models
    Fig. 5. Comparison of loss value curves of different models
    Comparison of visualization for SAU-Net segmentation results. (a) The cross-sectional view of prediction; (b) the cross-sectional view of ground truth; (c) the cross-sectional view of overlap between prediction and ground truth; (d) the 3D view of overlap between prediction and ground truth
    Fig. 6. Comparison of visualization for SAU-Net segmentation results. (a) The cross-sectional view of prediction; (b) the cross-sectional view of ground truth; (c) the cross-sectional view of overlap between prediction and ground truth; (d) the 3D view of overlap between prediction and ground truth
    TypeSourceNumber
    Training datasetMICCAI 2015 training dataset38
    Head and Neck Cetuximab collections46
    Public dataset of the Quebec Institute of Canada177
    Test datasetMICCAI 2015 test dataset10
    Table 1. Source and distribution of dataset
    OrganBaselineBaseline+ResBaseline+SESAU-Net
    Brainstem0.7730.8340.8570.884
    Chiasm0.4840.4950.5220.554
    Mandible0.8300.8580.9170.932
    Optic.L0.6620.6920.7120.738
    Optic.R0.6280.6830.7090.729
    Paro.L0.7870.8180.8630.887
    Paro.R0.7680.8240.8590.881
    Subm.L0.7230.7430.7980.812
    Subm.R0.7320.7380.8050.820
    Average0.7070.7430.7820.804
    Table 2. Comparison of DSC with different models
    OrganBaselineBaseline+ResBaseline+SESAU-Net
    FPRFNRFPRFNRFPRFNRFPRFNR
    Brainstem0.1170.1380.1100.1240.0720.1010.0630.091
    Chiasm0.1050.4610.0910.4570.0810.3470.0740.292
    Mandible0.1270.1190.1270.0930.0970.0580.1060.047
    Optic.L0.1180.4280.1060.4150.0920.3270.0340.295
    Optic.R0.1210.4370.1260.3970.1140.2940.1080.313
    Paro.L0.1370.1540.1200.1390.0880.1310.0760.092
    Paro.R0.1410.1610.1310.1480.1120.1290.0900.123
    Subm.L0.1150.1460.1090.1390.0920.1220.0840.117
    Subm.R0.1290.1520.1160.1420.0980.1180.1010.071
    Average0.1230.2440.1150.2280.0940.1810.0820.160
    Table 3. Comparison of FPR and FNR with different models
    OrgansRef.[13Ref.[14Ref.[2AnatomyNet17FocusNet19FocusNetv221SAU-Net
    Brainstem0.880-0.9030.8670.8750.8820.884
    Chiasm0.5570.580-0.5320.5960.7130.554
    Mandible0.930-0.9440.9250.9350.9470.932
    Optic.L0.6340.720-0.7210.7350.7900.738
    Optic.R0.6390.700-0.7060.7440.8170.729
    Paro.L0.827-0.8230.8810.8630.8980.887
    Paro.R0.814-0.8290.8740.8790.8810.881
    Subm.L0.723--0.8140.7980.8400.812
    Subm.R0.723--0.8130.8010.8380.820
    Average0.749--0.7930.8030.8450.804
    Table 4. Comparison of DSC score of different methods
    OrgansRef.[13Ref.[14AnatomyNet17FocusNet19FocusNetv221SAU-Net
    Brainstem4.59-6.42±2.382.14±0.62.32±0.72.02±0.8
    Chiasm2.782.81±1.65.76±2.493.16±1.32.25±0.82.65±1.3
    Mandible1.97-6.28±2.211.18±0.31.08±0.42.12±0.7
    Optic.L2.262.33±0.84.85±2.323.76±2.91.92±0.82.14±1.8
    Optic.R3.152.13±1.04.77±4.272.65±1.52.17±0.72.32±1.4
    Paro.L5.11-9.31±3.322.52±1.01.81±0.42.54±1.1
    Paro.R6.13-10.08±5.092.07±0.82.43±2.02.32±1.7
    Subm.L5.35-7.01±4.442.67±1.32.84±1.22.27±1.6
    Subm.R5.44-6.02±1.083.41±1.42.74±1.22.92±1.8
    Average4.14-6.302.622.172.37
    Table 5. Comparison of 95HD score of different methods
    ModelsMetrics
    Parameters /millionTime /s
    AnatomyNet0.730.68
    FocusNetv22.021.88
    SAU-Net0.790.51
    Table 6. Comparison of parameters and inference time of different methods
    Guogang Cao, Hongdong Mao, Shu Zhang, Ying Chen, Cuixia Dai. SAU-Net: Multiorgan Image Segmentation Method Improved Using Squeeze Attention Mechanism[J]. Laser & Optoelectronics Progress, 2022, 59(4): 0417003
    Download Citation