
Fang Liu, Lixia Lu, Guangwei Huang, Hongjuan Wang, Xin Wang. Landform Image Classification Based on Discrete Cosine Transformation and Deep Network[J]. Acta Optica Sinica, 2018, 38(6): 0620001
- Acta Optica Sinica
- Vol. 38, Issue 6, 0620001 (2018)
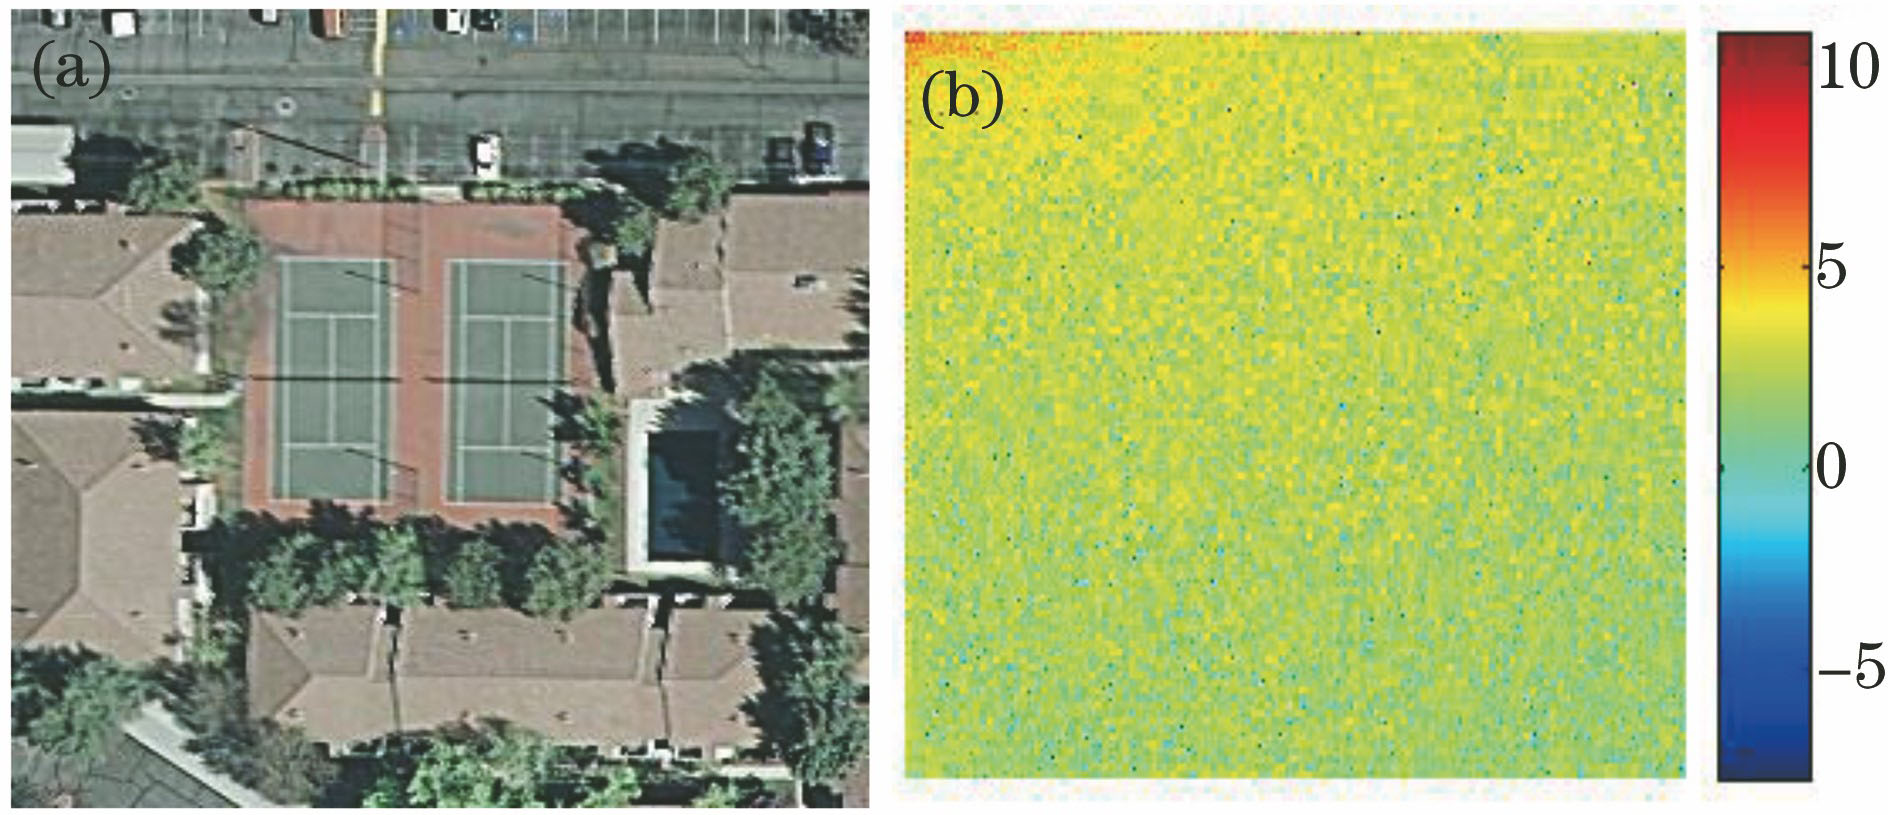
Fig. 1. (a) Original image and (b) energy distribution after DCT
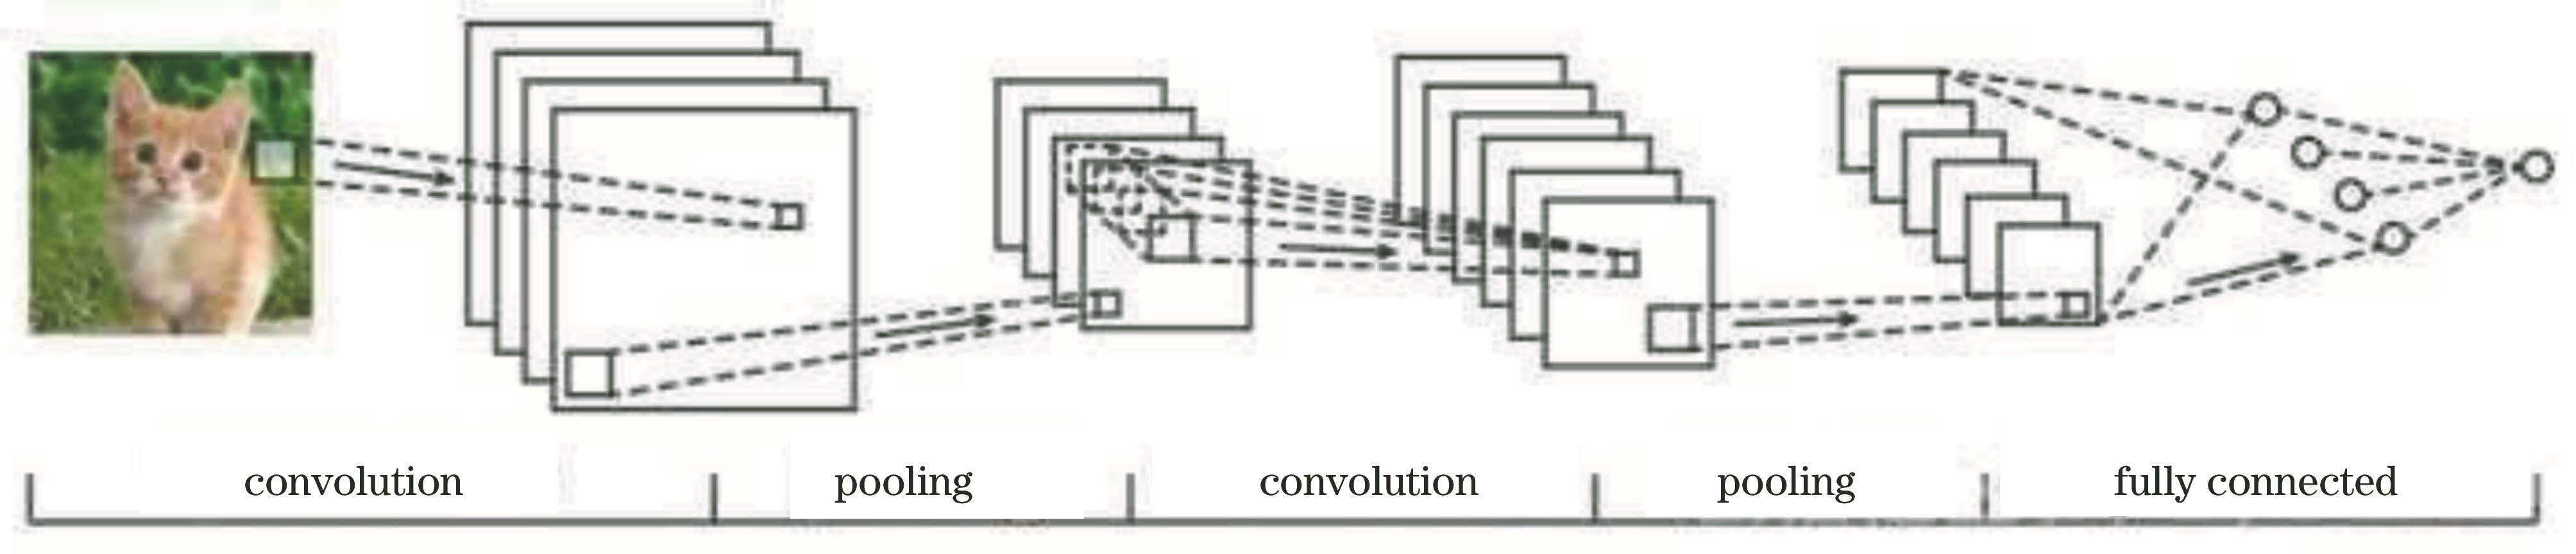
Fig. 2. Structure of CNN
Fig. 3. Three-dimensional spectrum diagram. (a) DCT coefficient spectrum of original image; (b) spectrum after the coefficient selection
Fig. 4. Structure of DCT-CNN model
Fig. 5. Flow chart of landform image classification algorithm based on DCT and deep network
Fig. 6. Example images in database. (a) UC Merced LU database; (b) UAV landing landform database
Fig. 7. Classification performance of each method when the number of training samples is different. (a) UC Merced LU database; (b) UAV landing landform database
Fig. 8. Image classification confusion matrix for UAV landing landform database
|
Table 1. Layer parameters of DCT-CNN network structure
|
Table 2. Effect of different methods on classification of UC Merced LU database
|
Table 3. Effect of different methods on classification of UVA landing landform database
|
Table 4. Comparison of the classification accuracy of different methods for UC Merced LU database
|
Table 5. Comparison of the classification accuracy of different methods for UAV landing landform database

Set citation alerts for the article
Please enter your email address
© Copyright 2018-2021 | Chinese Laser Press. All Rights Reserved 沪ICP备15018463号-20