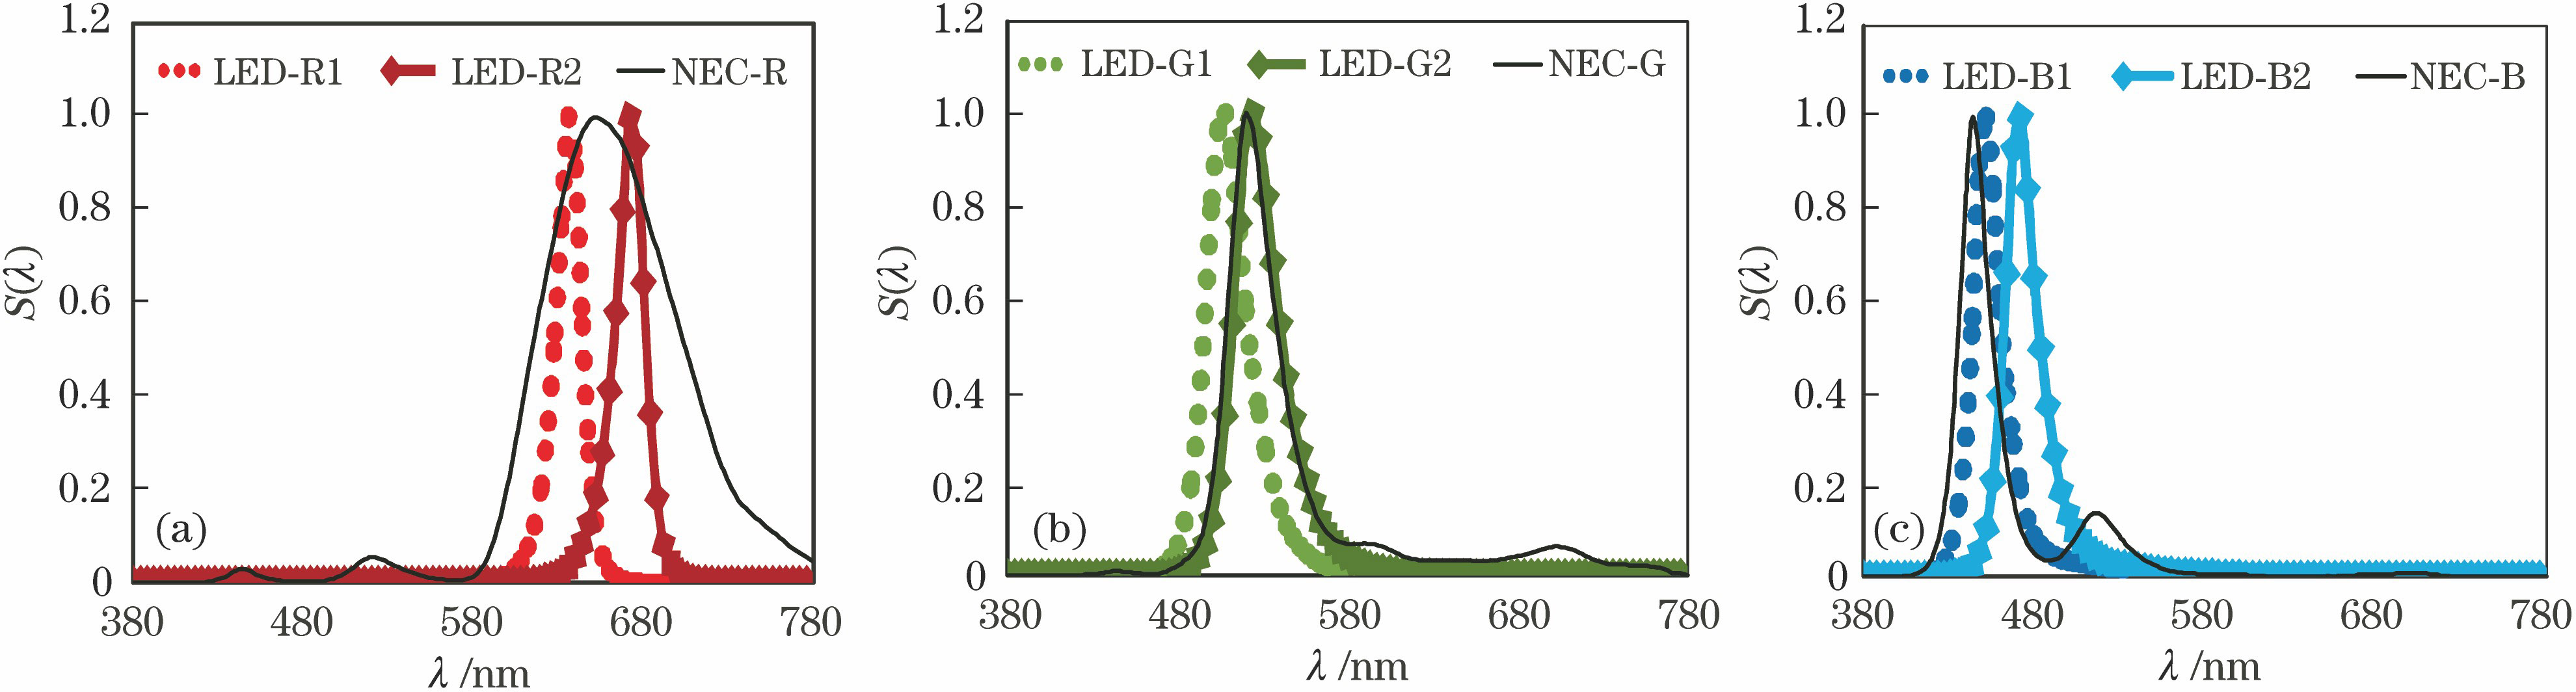
Fig. 1. Normalized spectral power distributions of the primary colors of the target and matched devices. (a) R channel; (b) G channel; (c) B channel
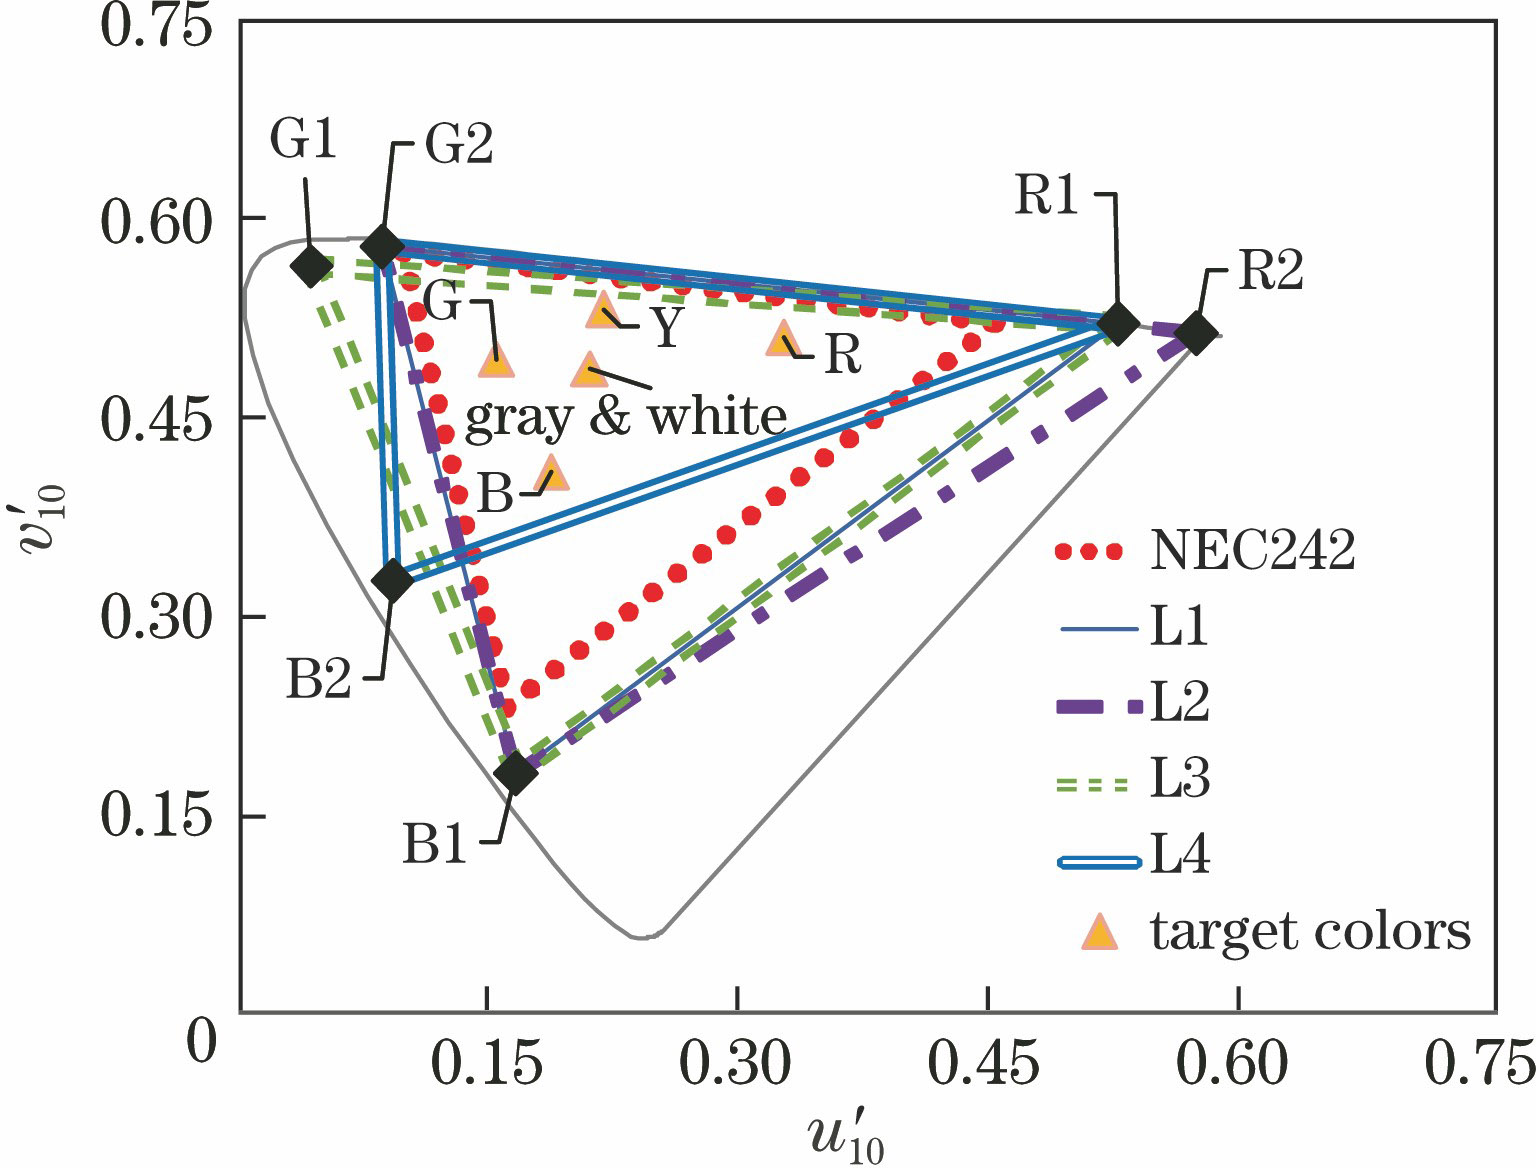
Fig. 2. Color gamuts of the target and matched devices
Fig. 3. Experimental related diagram. (a) Experimental setup; (b) LED-Panel and the controllers; (c) interface of software adjustment
Fig. 4. Comparisons of the matched colors with different CMFs in different RGB combinations. (a) L1; (b) L2; (c) L3; (d) L4
Fig. 5. Histograms of the Δ(u', v') values calculated by different color matching functions
Fig. 6. Observer variability ellipses from different LED-RGB primary color combinations. (a) 5 colors; (b) white
Fig. 7. Results from Ref. [15] with different primary-sets by CIE1964
Device | Primary | λ-measured /nm | FWHM /nm | x10 | y10 | u'10 | v'10 |
---|
Target device | NEC-R | 652 | 90 | 0.64 | 0.33 | 0.45 | 0.52 | NEC-G | 520 | 32 | 0.26 | 0.68 | 0.10 | 0.58 | NEC-B | 444 | 21 | 0.15 | 0.10 | 0.16 | 0.23 | Matched device | LED-R1 | 636 | 18 | 0.69 | 0.31 | 0.52 | 0.52 | LED-R2 | 672 | 20 | 0.71 | 0.29 | 0.57 | 0.51 | LED-G1 | 508 | 27 | 0.12 | 0.70 | 0.04 | 0.56 | LED-G2 | 524 | 31 | 0.24 | 0.72 | 0.08 | 0.58 | LED-B1 | 452 | 19 | 0.15 | 0.07 | 0.16 | 0.18 | LED-B2 | 472 | 22 | 0.11 | 0.18 | 0.09 | 0.33 |
|
Table 1. Primary colors and colorimetric information of the target and matched devices
Colors | CIE recommended value | Measured value | Δ |
---|
| | | | | | u'10 | v'10 |
---|
White | - | - | - | - | - | - | 0.21 | 0.49 | - | Gray | 62 | 0 | 0 | 62.42 | 0.11 | -0.41 | 0.21 | 0.49 | 0.60 | Red | 44 | 37 | 23 | 43.91 | 36.49 | 22.95 | 0.32 | 0.51 | 0.52 | Yellow | 87 | -7 | 47 | 87.25 | -6.91 | 46.85 | 0.22 | 0.53 | 0.30 | Green | 56 | -32 | 0 | 56.25 | -32.16 | -0.33 | 0.15 | 0.50 | 0.44 | Blue | 36 | 5 | -31 | 36.49 | 4.56 | -30.65 | 0.19 | 0.41 | 0.74 |
|
Table 2. Colorimetric parameters of the target colors
LED-conbination | L1 | L2 | L3 | L4 |
---|
Intra-observer | R1-G2-B1 | R2-G2-B1 | R1-G1-B1 | R1-G2-B2 | Min | 0.0017 | 0.0011 | 0.0018 | 0.0012 | Max | 0.0032 | 0.0032 | 0.0069 | 0.0032 | Mean | 0.0024 | 0.0024 | 0.0038 | 0.0024 | Inter-observer | R1-G2-B1 | R2-G2-B1 | R1-G1-B1 | R1-G2-B2 | Min | 0.0002 | 0.0002 | 0.0002 | 0.0005 | Max | 0.0188 | 0.0209 | 0.0241 | 0.0221 | Mean | 0.0039 | 0.0053 | 0.0069 | 0.0059 |
|
Table 3. Observer variations in the experiments
Colors | L1 | L2 | L3 | L4 | Mean |
---|
White | 0.0065 | 0.0075 | 0.0075 | 0.0085 | 0.0075 | Gray | 0.0054 | 0.0057 | 0.0063 | 0.0084 | 0.0065 | Red | 0.0070 | 0.0096 | 0.0080 | 0.0068 | 0.0079 | Yellow | 0.0050 | 0.0052 | 0.0073 | 0.0045 | 0.0055 | Green | 0.0057 | 0.0054 | 0.0083 | 0.0081 | 0.0069 | Blue | 0.0075 | 0.0068 | 0.0079 | 0.0138 | 0.0090 | Mean | 0.0062 | 0.0067 | 0.0076 | 0.0084 | 0.0072 |
|
Table 4. Δ(u', v') values of each color from different LED-RGB combinations
Color | Size | θ |
---|
L1 | L2 | L3 | L4 | Mean | L1 | L2 | L3 | L4 |
---|
White | 0.0039 | 0.0079 | 0.0085 | 0.0082 | 0.0071 | 68.35 | 51.42 | 127.00 | 139.41 | Gray | 0.0042 | 0.0060 | 0.0078 | 0.0090 | 0.0067 | 76.46 | 40.88 | 142.17 | 138.45 | Red | 0.0076 | 0.0085 | 0.0119 | 0.0075 | 0.0089 | 11.27 | 14.79 | 7.09 | 17.26 | Yellow | 0.0035 | 0.0069 | 0.0093 | 0.0052 | 0.0062 | 35.38 | 163.89 | 151.91 | 172.54 | Green | 0.0062 | 0.0076 | 0.0087 | 0.0077 | 0.0075 | 95.27 | 74.97 | 134.39 | 132.13 | Blue | 0.0075 | 0.0066 | 0.0099 | 0.0118 | 0.0089 | 71.58 | 84.23 | 99.53 | 139.03 | Mean | 0.0055 | 0.0072 | 0.0094 | 0.0082 | | - | - | - | - |
|
Table 5. Parameters of the observer variability ellipses from different LED-RGB primary color combinations
Combination | ΔR /nm | ΔG /nm | ΔB /nm |
---|
L1 | -16 | 4 | 8 | L2 | 20 | 4 | 8 | L3 | -16 | -12 | 8 | L4 | -16 | 4 | 28 |
|
Table 6. Comparison of the peak wavelength of the target and matched devices with different combinations