
Xuewei Deng, Xiaoxia Huang, Deen Wang, Ying Yang, Xin Zhang, Dongxia Hu. Beam wavefront retrieval by convoluted spatial spectral benchmark[J]. Matter and Radiation at Extremes, 2021, 6(4): 045902
- Matter and Radiation at Extremes
- Vol. 6, Issue 4, 045902 (2021)
Abstract
I. INTRODUCTION
Optical wavefront sensing techniques are widely used in many areas, such as astronomical observations, laser systems, manufacture of optical devices, and biomedical imaging.1–13 Up to now, three main wavefront sensing methods have been used: (a) the interferometric method,14,15 (b) the wavefront slope or wavefront curvature sensing method,16–18 and (c) the iterative calculation method from diffraction patterns.19–22 The first two of these methods both suffer from certain disadvantages. The interferometric method uses various types of interferometer to detect interference patterns, which demands a high degree of environmental stability and means that this method is applicable only under strictly controlled laboratory conditions. The iterative calculation method is very time-consuming owing to the need for multiple iterative computational procedures. The wavefront slope or curvature sensing method is based on the detection of wavefront slopes, gradients, or curvature, followed by a simple reconstruction calculation. It is convenient to apply and does not require special environmental conditions, and is therefore widely used. Some versions of this method modulate the wavefront slopes into an intensity distribution, using devices such as shearing interferometers, pyramids, and cross phase contrast sensors.23 The most commonly used wavefront slope sensing technique employs the classical Shack–Hartmann sensor, which modulates the wavefront slopes into a displacement distribution of foci.
The Shack–Hartmann sensor divides a light beam into sub-apertures with a lens array and captures all the focal positions of these sub-apertures. This allows the tilts of the beamlets to be measured, and these can be used to reconstruct the wavefront slope of the whole beam.24–27 Extracting the tilt of a beamlet from the relative separation of the focus from its original position is the key aspect of the Shack–Hartmann method. With a lens array, the relative movement of the focus of each beamlet can be captured directly, thus providing the focus displacement, i.e., the beamlet tilt, in a straightforward manner and allowing rapid wavefront reconstruction and real-time sensing.
Inspired by the basic principle of the Shack–Hartmann method, we propose here a method for wavefront retrieval from the near-field intensity distribution in the context of a 4f lens system. By inserting a benchmark at the Fourier plane of the 4f system, we generate convolution between the benchmark and the optical field after the output ends. We demonstrate that by dividing the beam intensity distribution after the 4f system and analyzing the relative movement of the focus of each sub-aperture with the benchmark, the beamlet tilt can be revealed, enabling reconstruction of the wavefront of the whole beam. By changing the F-number of the 4f system’s lens, either a large dynamic range or high precision can be achieved. The greatest advantage of this method is its ability to perform sub-aperture division with one capture of the near-field intensity distribution while keeping any loss of precision in calculations within tolerable limits. Meanwhile, the wavefront error arising from the beamline does not have any impact on the accuracy of this method.
II. WAVEFRONT RETRIEVAL SCHEME, THEORETICAL ANALYSIS, AND NUMERICAL SIMULATION
A. Wavefront retrieval scheme
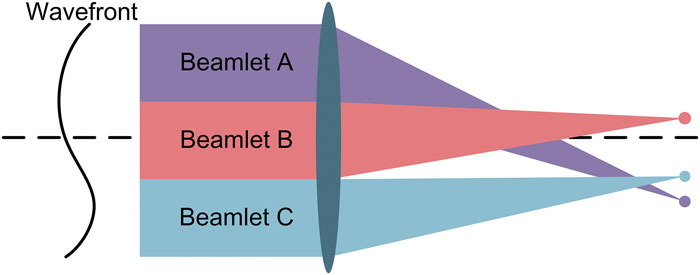
It is a basic optical principle that for a lens-focusing system as shown in Fig. 1, each segment with its own wavefront distribution focuses at a different position on the focal plane. That is to say, the displacement of the focus generated by each segment is linked to its own wavefront distribution. Then, similarly to the Shack–Hartmann method of wavefront retrieval, the wavefront slope of the whole beam can be reconstructed from the foci. The great advantage of this lens-focusing system over the Shack–Hartmann method is the flexibility of beam division that it allows. However, detecting and identifying the small, nuanced foci on the focal plane is an almost impossible task.
![]()
Figure 1.Different wavefront slopes in each region focus at different positions.
Guided by this principle and concentrating on tackling the associated difficulties, an implementable scheme of wavefront retrieval for a 4f lens system is established as shown in Fig. 2. Alongside beam transmission, the light beam passes through the first lens and focuses at the Fourier plane, after which it passes through the second lens and is finally recorded after the 4f system. A benchmark is inserted at the Fourier plane of the 4f system to serve as a position mark for the foci. As depicted in Fig. 2(a), the whole beam is considered as an assembly of many sub-apertures, with the focus of each sub-aperture beamlet located at a relative displacement from the benchmark at the Fourier plane. Finally, the recording plane records the optical intensity distribution, which involves convoluted information of benchmark and focus. Then, in the reverse manner, the wavefront of this beamlet can be retrieved. Analogously, as illustrated in Fig. 2(b), the whole beam can be reconstructed in two steps. First, the recorded near-field intensity after the 4f system is divided into multiple sub-apertures, and the displacements of the foci of all the sub-aperture at the Fourier plane are captured by Fourier analysis. Then, the wavefront of the whole beam is derived by calculating the statistical positions of the foci. As this method shares the same principle as the Shack–Hartmann sensor, it can be expected to achieve at least the same retrieval accuracy. In fact, with more flexible division of the output image, a higher retrieval accuracy may be achievable.
![]()
Figure 2.Geometry of beam propagation and wavefront retrieval scheme in terms of (a) a single beamlet and (b) the whole aperture.
B. Theoretical analysis
If it is assumed that the input optical field E in Fig. 2 consists of beamlets
The first step of the recovery process is the reverse calculation of the movements of the foci from a given recorded image. Here, the reverse calculation giving results in the Fourier plane is
Only the centroid position of the Fourier distribution contributes to the phase retrieval calculation. In Eq. (5), the first term represents just the centroid position of this beamlet relative to the benchmark, while the second term involves information about the interaction of the two beamlets. This second term is small and is not needed for phase retrieval. It can therefore be ignored in the further calculations, and so the expression to recover the wavefront of beamlet 1 can be written as
Analogously, all the remaining terms have the same form as Eq. (6). The focus displacement is extracted from this Fourier distribution and contains the position of the beamlet relative to the benchmark. After the above calculation, the second stage of wavefront retrieval proceeds through a numerical integration method, such as the Zernike fitting algorithm, which is conventionally employed for wavefront retrieval of Shack–Hartmann sensors.
C. Numerical simulation
According to the above scheme and theoretical analysis, a numerical simulation is performed to evaluate the proposed method. The simulation beamline is established as shown in Fig. 3(a). The wavelength of the beam is 1053 nm, the focal length of each lens is 13 m, the calculating aperture is 576 × 576 mm2 with samplings of 8192 × 8192, and the beam aperture is 360 × 360 mm2. A cross-benchmark with a width of 60 samplings is placed at the Fourier plane, while its length is set to be large enough to cover the entire focal spot. The recorded image is produced by a given amplitude and phase, transmitting through the lens, interacting with the cross-benchmark, and projecting onto the recording plane after the 4f system. To imitate a realistic beam condition, randomized noise at a signal-to-noise ratio of 1:100 is added to the input intensity distribution to implement reliable and accurate wavefront reconstruction. Figures 3(b)–3(d) depict the input intensity distribution with randomized noise, the input wavefront distribution, and the output intensity distribution, respectively.
![]()
Figure 3.Simulation setup. (a) Simulation beamline. (b) Input intensity distribution. (c) Input wavefront distribution. (d) Output intensity distribution.
We then execute the recovery process to verify the wavefront retrieval scheme. As shown in Fig. 4(a), the image of the output intensity distribution is split into 16 × 16 sub-apertures. Figures 4(b) and 4(c) show the intensity distribution of one of these sub-apertures and the corresponding Fourier distribution from Eq. (5), respectively. The focal spot and cross-benchmark can be seen in the Fourier distribution, and their relative position can be calculated from this pattern. The same procedure can be applied to all the other sub-apertures, and all the displacements can thus be captured to recover the wavefront using the Zernike fitting algorithm. Figure 4(d) shows this recovered wavefront. Compared with the original input phase, the phase error is controlled within 0.0694λ of peak and valley (PV) and 1.14% of the root mean square (rms), and the Zernike polynomial coefficients up to tenth order are also very close. These simulation results demonstrate that the proposed scheme has as good a performance and as high an accuracy as the Shack–Hartmann sensing method, but with greater flexibility.
![]()
Figure 4.Recovery process and results of simulation. (a) Sub-aperture division from
III. EXPERIMENTAL RESULTS
A. Experimental verification
To verify the proposed scheme, an experiment is conducted using the setup shown in Fig. 5. A distributed feedback (DFB) fiber laser generates continuous light at a wavelength of 1053 nm. A φ = 120 mm, f = 1200 mm lens redistributes this point light into parallel light with a beam aperture of φ = 120 mm. A second similar lens then focuses this parallel beam at the Fourier plane, where a cross-benchmark of width 0.5-mm is placed. After interacting with this cross-benchmark, the light beam propagates through a third φ = 30 mm, f = 300 mm lens, and is thereby changed from a conical beam into a smaller parallel beam. Finally, this output beam, after the 4f system, is recorded by a commercial charge-coupled device (CCD). The spatial resolution of the recorded image is 4864 × 3232 pixels, with a pixel pitch of 5 µm. A 100 × 100 mm2 continuous phase plate (CPP) is adopted as the original phase distribution. During the experimental procedure, the CPP can be removed from or inserted into the beamline to generate records of background and effective information separately, for the purpose of eliminating lens aberration and acquiring effective information about the CPP. The Zernike fitting algorithm is then applied to reconstruct the continuous phase of the inserted CPP from the recorded image.
![]()
Figure 5.Experimental setup.
For the experimental beamline, the phase distribution of the CPP and the recorded image are shown in Figs. 6(a) and 6(b), respectively. Using details of lens aberration obtained in advance, experimental adjustments are performed so that the recorded image only contains phase information about the CPP. In the retrieval calculation, the recorded image is divided into 13 × 9 pieces of a Gaussian distribution, with 640 × 640 pixels in each piece and with half the area of each piece overlapping with the adjacent one to give higher retrieval accuracy. One of the divided pieces is shown by a black box in Fig. 6(b), and its adjacent pieces by white boxes. Figure 6(c) shows the calculated distribution of one piece at the Fourier plane, clearly displaying the relative positions of the focus spot and cross-benchmark. Note that the dim cross-benchmark is artificially lightened in Fig. 6(c) for a clearer view. After collection of the relative positions of all pieces and use of the Zernike fitting algorithm, the phase of the whole beam is recovered as shown in Fig. 6(d). The retrieval error is shown by the phase error distribution in Fig. 6(e) and by the errors in the Zernike polynomial coefficients up to tenth order in Fig. 6(f). The results shows good agreement with the phase distribution of the inserted CPP, with phase error evaluations of 0.1037λ of PV and 1.04% of rms.
![]()
Figure 6.Experimental results. (a) Phase distribution of CPP. (b) Recorded image with illustration of sub-aperture division and overlapping layout. (c) Fourier distribution of the chosen sub-aperture. (d) Recovered wavefront of the whole aperture. (e) Retrieval error compared with the phase distribution of the CPP. (f) Errors in Zernike polynomial coefficients compared with the original phase.
B. Discussion
The performance of any method for detecting or retrieving wavefronts is limited by spatial resolution, dynamic range, and sensitivity. For Shack–Hartmann sensors, these limits are determined respectively by the number of lenslets, their focal length, and their diameter.27 In our proposed scheme, we also have to accept a trade-off between dynamic range and sensitivity because of the focal length and diameter of the lens we use. With regard to spatial resolution, the limit in our scheme is ultimately given by the pixel size and number of divided pieces. However, our scheme is capable of providing higher spatial resolution by dividing the near-field after the 4f system into a greater number and different sizes of sub-apertures. Smaller sub-apertures can improve retrieval accuracy to some degree. Meanwhile, different overlapping areas between adjacent pieces can also be used to achieve higher retrieval accuracy. For instance, keeping 640 × 640 pixels for each piece, we tested configurations with three-quarter overlap and no overlap, corresponding to 25 × 17 and 7 × 5 sub-apertures, respectively. Also, for the same overlaps, we tested sub-apertures with a size of 480 × 480 pixels. The results for the retrieval phase error are compared in Table I. It can be seen that to achieve higher retrieval accuracy, we can simply divide the near-field after the 4f system into a greater number of sub-apertures, which is a much more flexible and convenient approach than the use of a fixed array of lenslets in Shack–Hartmann sensors.
| Overlap | 640 × 640 pixels | 480 × 480 pixels | ||
|---|---|---|---|---|
| PV (λ) | RMS (%) | PV (λ) | RMS (%) | |
| Three-quarter | 0.0923 | 1.03 | 0.0864 | 1.15 |
| Half | 0.1037 | 1.04 | 0.0984 | 1.08 |
| None | 0.1116 | 1.11 | 0.0989 | 1.30 |
Table 1. Retrieval error for different sizes of sub-aperture and different overlaps.
IV. CONCLUSION
In summary, we have introduced a wavefront retrieval method based on a 4f lens system. Instead of resorting to an array of lenslets to capture positions of foci, these positions are acquired by dividing the near-field image after the 4f system and performing a reverse calculation. A theoretical analysis and numerical simulation demonstrate the good performance of this method, which achieves a retrieval accuracy within 0.0694λ of PV and 1.14% of rms. Experimental results verify the theoretical analysis and numerical simulation, giving retrieval errors of 0.1037λ of PV and 1.04% of rms. Further calculations show that by dividing the near-field after the 4f system into a greater number of sub-apertures, the retrieval accuracy can be increased even further. Consequently, this method allows both near-field and wavefront to be captured by just one CCD. The flexibility and convenience of this retrieval method show its great potential for application to real-time wavefront sensing.
AUTHORS’ CONTRIBUTIONS
All the authors made substantive intellectual contributions to this work. Their individual contributions were as follows. X.D. and D.H. were responsible for the study concepts. X.D. was responsible for the study design. X.D. and X.H. carried out the literature search. X.H., D.W., Y.Y., and X.Z. carried out the experimental studies. Y.Y. and X.Z. were responsible for data acquisition. X.H. and D.W. carried out the data analysis. X.H. and X.D. were responsible for manuscript preparation, editing, and revision.
ACKNOWLEDGMENTS
Acknowledgment. This work was supported by the National Natural Science Foundation of China (NSFC) (Grant Nos. 61775199 and 61805223). The authors are also grateful for guidance from their colleagues in the Laser Fusion Research Center.
References
[1] D.Gabor. Microscopy by reconstructed wave-fronts. Proc. R. Soc. London, Ser. A, 197, 454-487(1949).
[2] J. F.Bille, S.Goelz, B.Grimm, J.Liang. Objective measurement of wave aberrations of the human eye with the use of a Hartmann–Shack wave-front sensor. J. Opt. Soc. Am. A, 11, 1949-1957(1994).
[3] C. J.Burrows, J. E.Krist. Phase-retrieval analysis of pre- and post-repair hubble space telescope images. Appl. Opt., 34, 4951-4964(1995).
[4] J. V.Burke, D. R.Luke, R. G.Lyon. Optical wavefront reconstruction: Theory and numerical methods. SIAM Rev., 44, 169-224(2002).
[5] M.Gao, L. A.Nagahara, I.Vartanyants, R.Zhang, J. M.Zuo. Atomic resolution imaging of a carbon nanotube from diffraction intensities. Science, 300, 1419-1421(2003).
[6] P. P.Banerjee, G.Nehmetallah. Applications of digital and analog holography in three-dimensional imaging. Adv. Opt. Photonics, 4, 472-553(2012).
[7] P.Artal. Optics of the eye and its impact in vision: A tutorial. Adv. Opt. Photonics, 6, 340-367(2014).
[8] A.Faridian, P.Gao, D.Naik, W.Osten, G.Pedrini, A.Singh, M.Takeda. Phase retrieval methods for optical imaging and metrology.
[9] H. N.Chapman, O.Cohen, Y. C.Eldar, J.Miao, M.Segev, Y.Shechtman. Phase retrieval with application to optical imaging: A contemporary overview. IEEE Signal Process. Mag., 32, 87-109(2015).
[10] X.-F.Meng, S.-Q.Wang, Y.-R.Wang, X.-L.Yang, Y.-K.Yin. Phase retrieval algorithm for optical information security. Chin. Phys. B, 28, 084203(2019).
[11] Y.Chen, W.Dai, Z.Dang, X.Deng, B.Feng, L.Guo, D.Hu, H.Jia, F.Jing, D.Lin, L.Liu, Z.Peng, F.Wang, F.Wang, X.Wei, Y.Xiang, X.Xie, D.Xu, X.Yuan, R.Zhang, X.Zhang, W.Zheng, W.Zhou, Q.Zhu. Laser performance upgrade for precise ICF experiment in SG-Ⅲ laser facility. Matter Radiat. Extremes, 2, 243-255(2017).
[12] X.Chen, Y.Cui, P.Du, W.Feng, S.Fu, Y.Gao, Y.Hua, X.Huang, L.Ji, F.Li, X.Li, D.Liu, J.Liu, J.Liu, W.Ma, W.Pei, D.Rao, C.Shan, H.Shi, Z.Sui, X.Sun, T.Wang, L.Xia, T.Zhang, X.Zhao, J.Zhu. Development of low-coherence high-power laser drivers for inertial confinement fusion. Matter Radiat. Extremes, 5, 065201(2020).
[13] C.Liu, F.Liu, J.Vargas, S.Wang, Q.Wei, L.Xue, M.Yu, M.Zhang. Rapid quantitative interferometric microscopy using fast Fourier transform and differential–integral based phase retrieval algorithm (FFT-DI-PRA). Opt. Commun., 456, 124613(2020).
[14] S.Wang, L.Xue, K.Yan. Quantitative interferometric microscopy with two dimensional Hilbert transform based phase retrieval method. Opt. Commun., 383, 537-544(2017).
[15] Q.Hao, Y.Hu, X.Sun, S.Wang, M.Ye. Study on non-phase-shifting phase retrieval methods for interferogram with large phase gradient. Proc. SPIE, 11439, 11439C(2019).
[16] W. H.Southwell. Wave-front estimation from wave-front slope measurements. J. Opt. Soc. Am., 70, 998-1006(1980).
[17] D.Claus, W.Osten, G.Pedrini. Iterative phase retrieval based on variable wavefront curvature. Appl. Opt., 56, F134-F137(2017).
[18] M.Mateen, M.Oliker. A direct reconstruction technique to retrieve phase in a non-linear curvature wavefront sensor. Proc. SPIE, 10703, 107035S(2018).
[19] M. A.Pfeifer, J. A.Pitney, I. K.Robinson, I. A.Vartanyants, G. J.Williams. Reconstruction of the shapes of gold nanocrystals using coherent x-ray diffraction. Phys. Rev. Lett., 87, 195505(2001).
[20] A. M.Maiden, J. M.Rodenburg. An improved ptychographical phase retrieval algorithm for diffractive imaging. Ultramicroscopy, 109, 1256-1262(2009).
[21] K.Egiazarian, V.Katkovnik, N. V.Petrov, I.Shevkunov. Computational super-resolution phase retrieval from multiple phase-coded diffraction patterns: Simulation study and experiments. Optica, 4, 786-794(2017).
[22] H.Arguello, J.Bacca, S.Pinilla. Super-resolution phase retrieval from designed coded diffraction patterns. IEEE Trans. Image Process., 29, 2598-2609(2020).
[23] Q.Bian, M.Gong, L.Huang, T.Li, C.Zhou. Wavefront sensing based on phase contrast theory and coherent optical processing. Chin. Phys. B, 25, 070701(2016).
[24] B. C.Platt, R.Shack. History and principles of Shack–Hartmann wavefront sensing. J. Refractive Surg., 17, S573-S577(2001).
[25] Y.Luan, X.Zhang, K.Zhou, X.Zhou. Efficient method of Shack-Hartmann wavefront sensor assembly. Proc. SPIE, 10256, 102560U(2017).
[26] C.Chang, S.Chen, Y.Chen. Rapid and highly integrated FPGA-based Shack-Hartmann wavefront sensor for adaptive optics system. Proc. SPIE, 10502, 1050203(2018).
[27] P.Clemente, V.Duran, J.Lancis, F.Soldevila, E.Tajahuerce. Phase imaging by spatial wavefront sampling. Optica, 5, 164-174(2018).


Set citation alerts for the article
Please enter your email address

© Copyright 2018-2021 | Chinese Laser Press. All Rights Reserved 沪ICP备15018463号-20