Author Affiliations
Information and Navigation College, Air Force Engineering University of PLA, Xi'an, Shaanxi 710077, Chinashow less
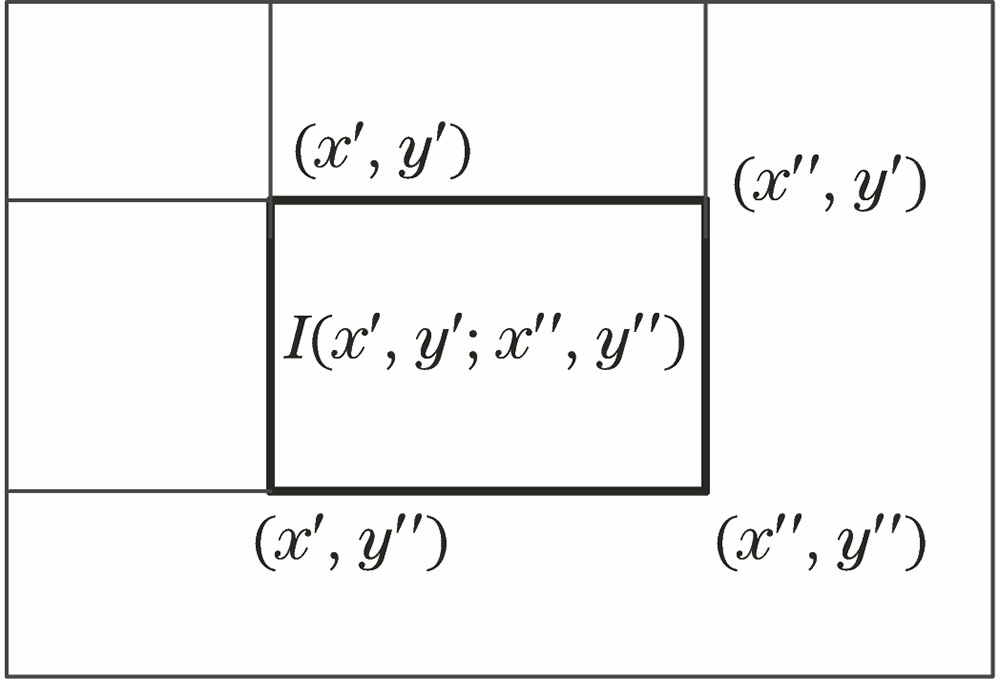
Fig. 1. Integral image
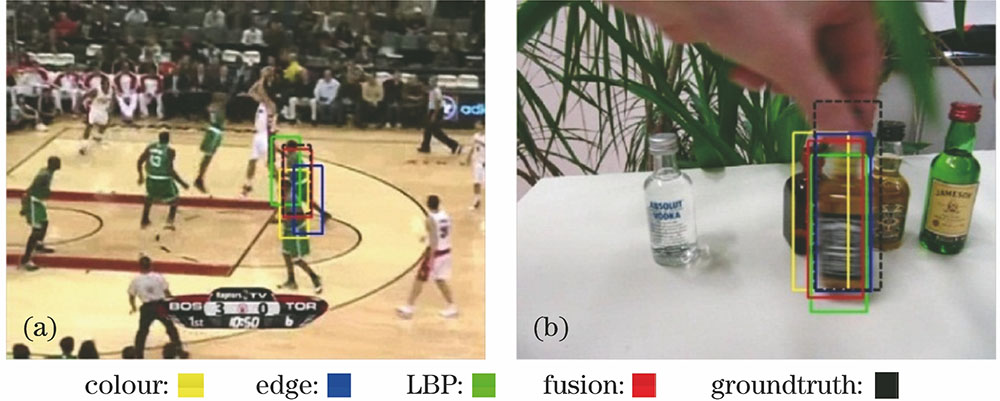
Fig. 2. Comparison of tracking results of different features. (a) The 649th frame of Basketball sequence; (b) the 873rd frame of Liquor sequence
Fig. 3. Population generation method of the ith frame
Fig. 4. Qualitative comparison of eight tracking algorithms. (a) Basketball; (b) Bolt; (c) David3; (d) Football1; (e) Jumping; (f) Liquor; (g) Matrix; (h) Skiing; (i) Ironman; (j) Jogging1; (k) Lemming; (l) MotorRolling
Fig. 5. Center position error curves. (a) Basketball; (b) Bolt; (c) David3; (d) Football1; (e) Jumping; (f) Liquor; (g) Matrix; (h) Skiing; (i) Ironman; (j) Jogging1; (k) Lemming; (l) MotorRolling
Fig. 6. Overlap rate curves. (a) Basketball; (b) Bolt; (c) David3; (d) Football1; (e) Jumping; (f) Liquor; (g) Matrix; (h) Skiing; (i) Ironman; (j) Jogging1; (k) Lemming; (l) MotorRolling
Fig. 7. Curves of precision and success rate. (a) Precision; (b) success rate
Fig. 8. Comparison of tracking precision under 11 scenes
Fig. 9. Comparison of tracking success rate under 11 scenes
xi | bi | f(x)≥f(b) | Δθi | s(αiβi) |
---|
αiβi>0 | αiβi<0 | αi=0 | βi=0 |
---|
0 | 0 | False | 0 | 0 | 0 | 0 | 0 | 0 | 0 | True | 0 | 0 | 0 | 0 | 0 | 0 | 1 | False | 0 | 0 | 0 | 0 | 0 | 0 | 1 | True | 0.05π | -1 | +1 | ±1 | 0 | 1 | 0 | False | 0.01π | -1 | +1 | ±1 | 0 | 1 | 0 | True | 0.025π | +1 | -1 | 0 | ±1 | 1 | 1 | False | 0.005π | +1 | -1 | 0 | ±1 | 1 | 1 | True | 0.025π | +1 | -1 | 0 | ±1 |
|
Table 1. Generative rules of rotation angle of quantum rotation gate
Name | DLT | TLD | Struck | ASLA | DSST | SST | MIL | Proposed algorithm |
---|
Basketball | 53.9 | 2.3 | 9.93 | 53.9 | 14.3 | 22.2 | 27.5 | 90.1 | Bolt | 4.29 | 1.4 | 1.71 | 1.4 | 100.0 | 1.1 | 1.1 | 91.6 | David3 | 32.9 | 10.7 | 33.73 | 51.6 | 54.0 | 35.7 | 68.3 | 78.6 | Football1 | 52.4 | 46.0 | 82.4 | 44.6 | 41.9 | 58.1 | 82.4 | 56.7 | Jumping | 16.6 | 90.1 | 95.9 | 17.3 | 4.8 | 13.4 | 62.3 | 81.3 | Liquor | 20.5 | 56.6 | 41.1 | 23.6 | 40.8 | 23.6 | 20.2 | 91.3 | Matrix | 2.0 | 1.0 | 12.0 | 2.0 | 21.0 | 34.0 | 12.0 | 36.0 | Skiing | 7.4 | 7.4 | 3.7 | 11.1 | 7.4 | 9.9 | 7.4 | 30.4 | Ironman | 10.8 | 3.0 | 4.8 | 13.3 | 10.8 | 14.5 | 7.2 | 13.9 | Jogging1 | 22.5 | 96.4 | 21.8 | 22.5 | 22.5 | 22.2 | 22.2 | 92.8 | Lemming | 28.0 | 60.5 | 66.2 | 16.9 | 46.0 | 43.0 | 87.2 | 90.8 | MotorRolling | 7.3 | 15.9 | 16.5 | 11.0 | 6.7 | 7.3 | 7.3 | 30.5 |
|
Table 2. Comparison of coverage rate of tracking results%
Name | DLT | TLD | Struck | ASLA | DSST | SST | MIL | Proposed algorithm |
---|
Basketball | 12.0 | - | 118.3 | 82.6 | 111.6 | 105.9 | 91.9 | 10.8 | Bolt | - | - | 398.8 | 374.7 | 5.0 | 409.9 | 393.5 | 5.6 | David3 | 107.4 | - | 106.5 | 87.8 | 88.4 | 104.5 | 29.7 | 15.2 | Football1 | 10.4 | - | 5.5 | 12.2 | 20.5 | 15.7 | 5.6 | 8.9 | Jumping | 41.9 | 5.9 | 6.7 | 46.1 | 35.2 | 45.7 | 10.0 | 7.6 | Liquor | 153.3 | - | 91.0 | 146.7 | 99.3 | 146.7 | 141.9 | 23.2 | Matrix | 171.1 | - | 194.8 | 65.2 | 59.7 | 54.7 | 55.0 | 33.5 | Skiing | 244.5 | - | 251.8 | 266.6 | 220.1 | 269.9 | 267.0 | 89.4 | Ironman | 211.4 | - | 127.6 | 197.5 | 105.7 | 205.4 | 193.4 | 74.3 | Jogging1 | 113.0 | 6.7 | 62.0 | 104.6 | 112.0 | 114.6 | 96.3 | 12.3 | Lemming | 128.9 | - | 37.8 | 178.8 | 81.5 | 23.6 | 12.1 | 11.8 | MotorRolling | 170.7 | - | 145.6 | 201.4 | 289.6 | 377.0 | 161.0 | 101.8 |
|
Table 3. Comparison of average center position error of tracking resultspixel