• High Power Laser Science and Engineering
  • Vol. 7, Issue 3, 03000e55 (2019)
Wenpeng Wang1、†, Cheng Jiang1, Shasha Li1, Hao Dong1, Baifei Shen2, Yuxin Leng1, Ruxin Li1, and Zhizhan Xu1
Author Affiliations
  • 1State Key Laboratory of High Field Laser Physics, Shanghai Institute of Optics and Fine Mechanics, Chinese Academy of Sciences, Shanghai 201800, China
  • 2Department of Physics, Shanghai Normal University, Shanghai 200234, China
  • show less
    DOI: 10.1017/hpl.2019.40 Cite this Article Set citation alerts
    Wenpeng Wang, Cheng Jiang, Shasha Li, Hao Dong, Baifei Shen, Yuxin Leng, Ruxin Li, Zhizhan Xu. Monoenergetic proton beam accelerated by single reflection mechanism only during hole-boring stage[J]. High Power Laser Science and Engineering, 2019, 7(3): 03000e55 Copy Citation Text show less
    Electric field $E_{x}$ (blue solid line) and $E_{y}$ (red dash line), electron density (black dash–dot line), proton density (cyan dot line) at (a) $t=20T$, (b) $t=22.5T$ and (c) $t=25T$. (d) Trajectories of electrons (red solid line) and protons (gray solid line) in the simulations. (e) Phase space distributions of protons at $t=22.7T$ (red circles). The black solid line represents the velocity distribution at the end of the HB stage for protons initially at different positions of the foil ($v_{\text{end}}$ versus $x_{\text{initial}}$).
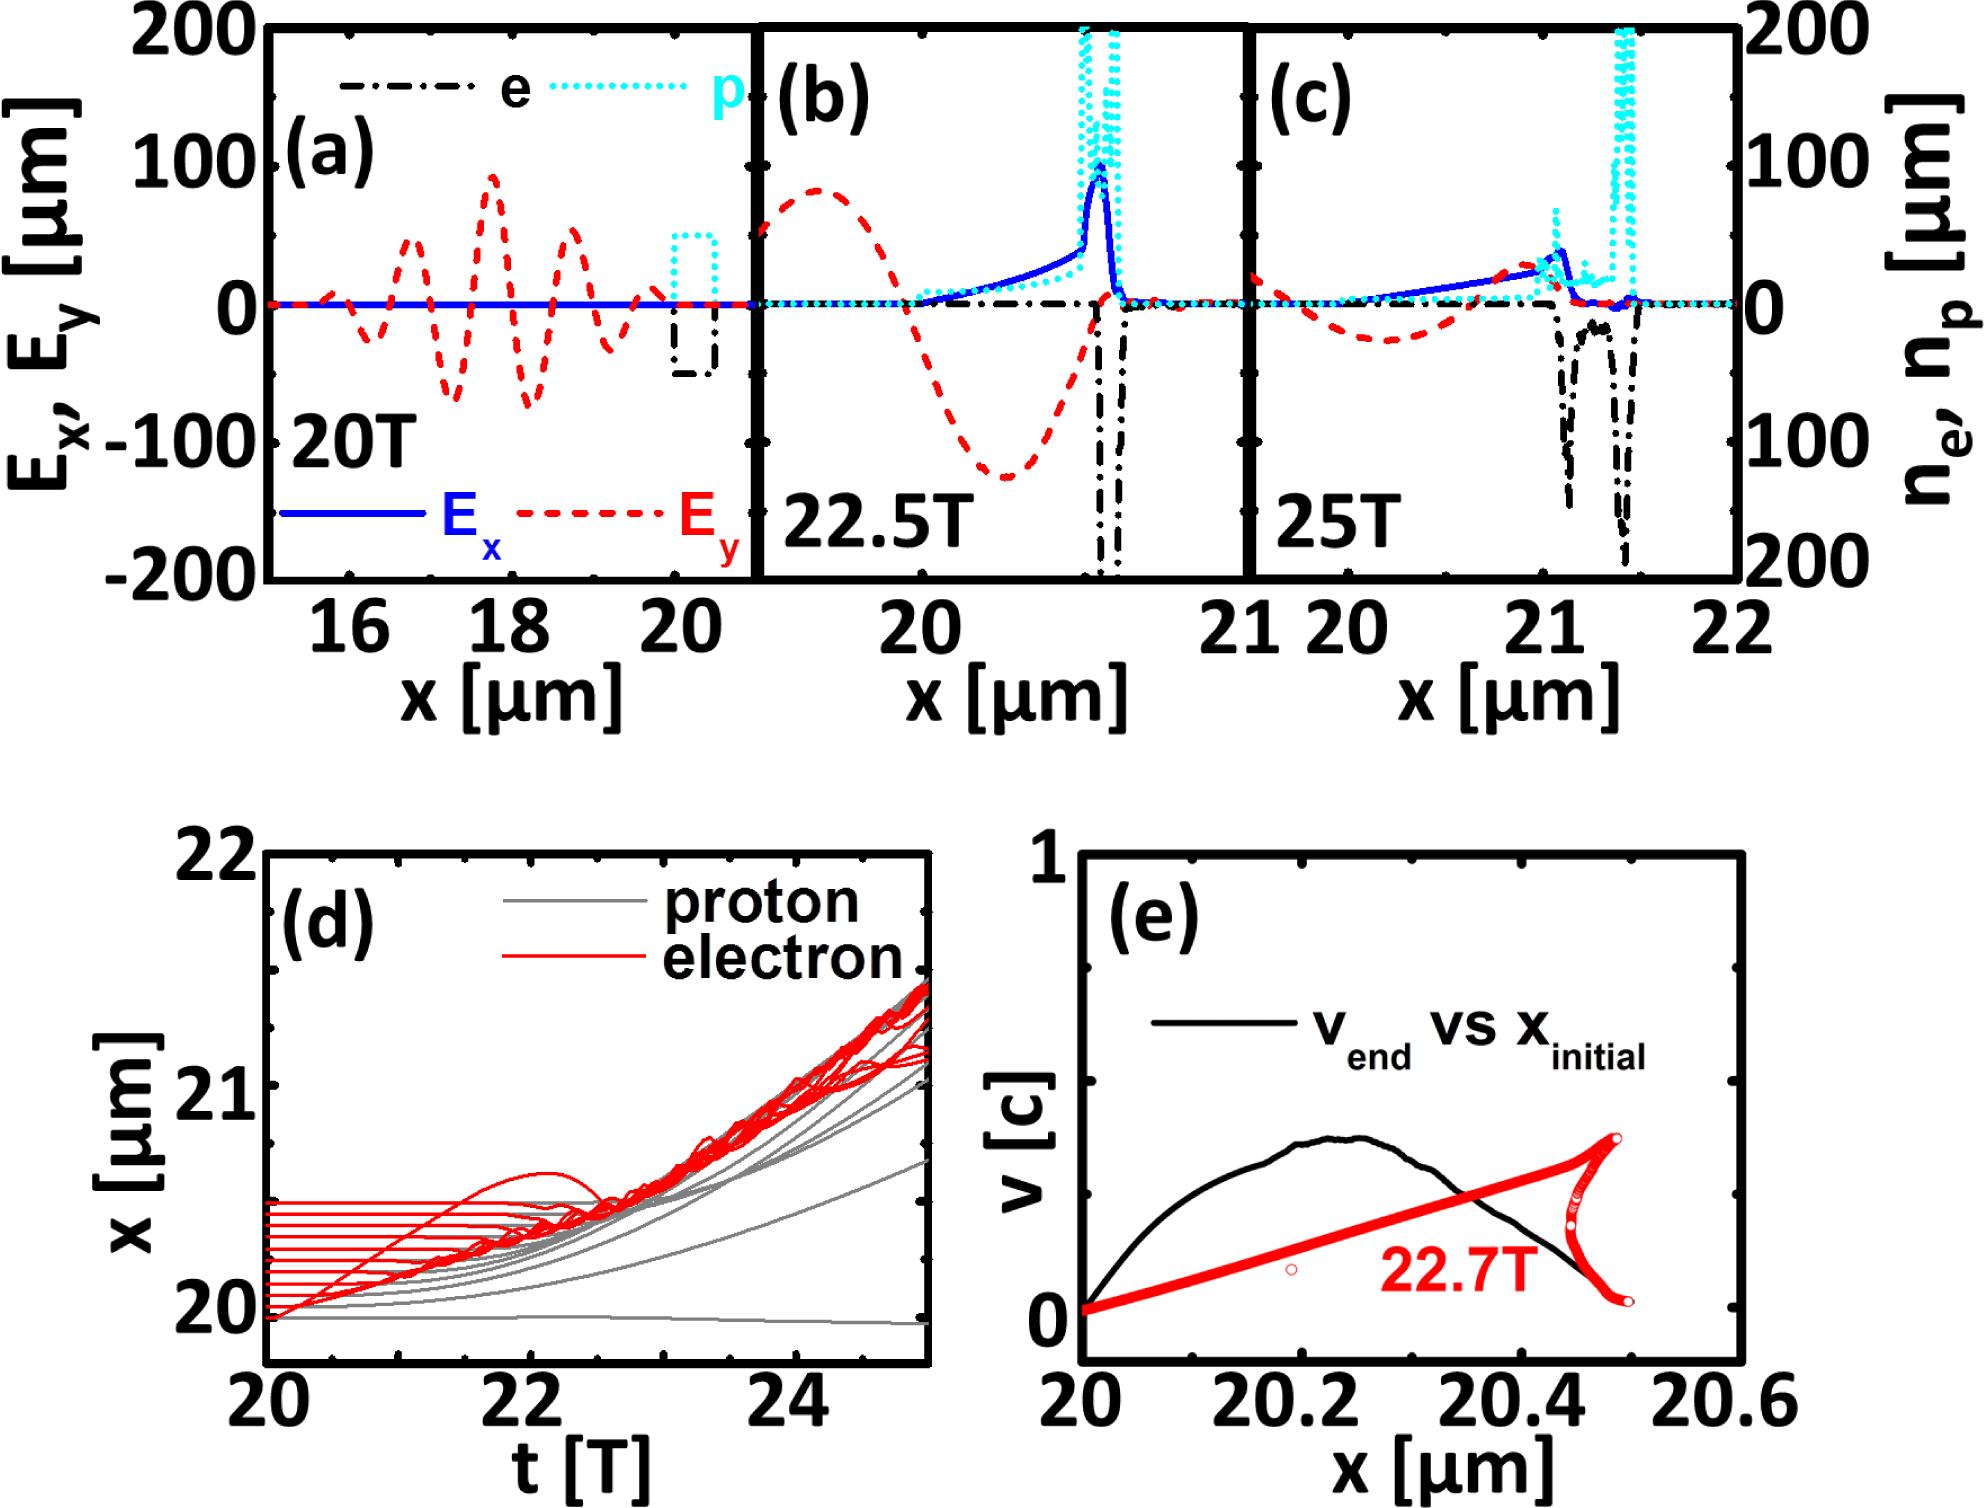
    Fig. 1. Electric field $E_{x}$ (blue solid line) and $E_{y}$ (red dash line), electron density (black dash–dot line), proton density (cyan dot line) at (a) $t=20T$, (b) $t=22.5T$ and (c) $t=25T$. (d) Trajectories of electrons (red solid line) and protons (gray solid line) in the simulations. (e) Phase space distributions of protons at $t=22.7T$ (red circles). The black solid line represents the velocity distribution at the end of the HB stage for protons initially at different positions of the foil ($v_{\text{end}}$ versus $x_{\text{initial}}$).
    (a) Relation between the velocity of the compressed electron layer $v_{\text{CEL}}$ and the steepness of the laser front $a_{0}/t_{\text{up}}$ according to Equation (5) for $n_{0}=50n_{\text{c}}$. (b) Evolutions of the velocity, $v_{\text{p}}$ (black solid line), and energy, $E_{\text{p}}$, of the proton layer during the HB stage.
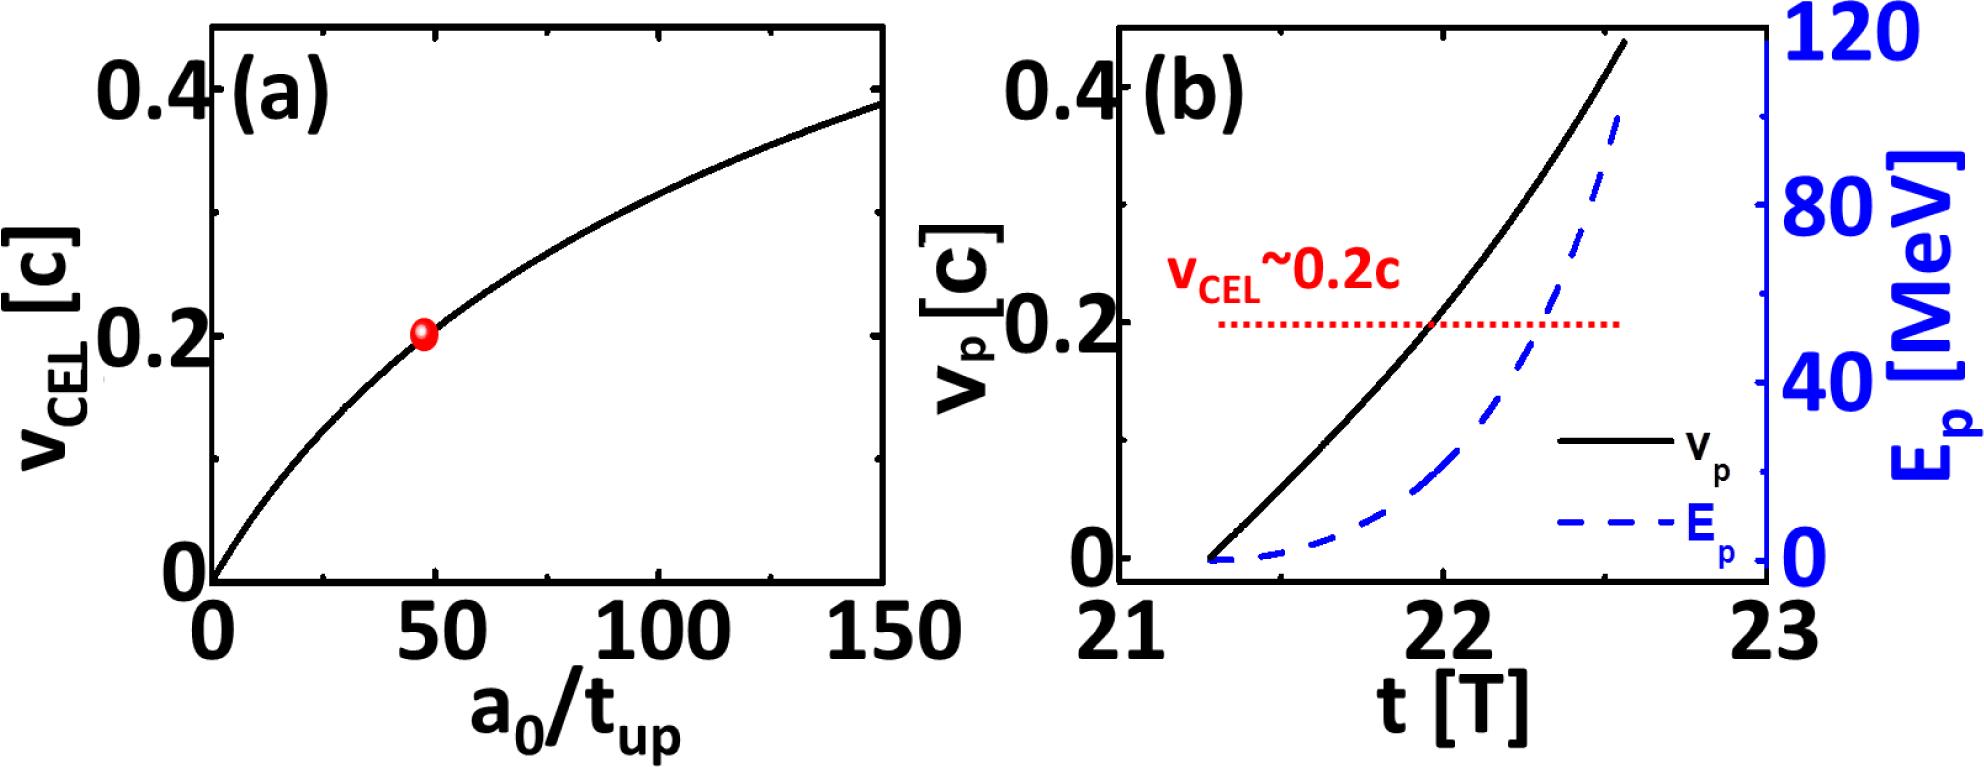
    Fig. 2. (a) Relation between the velocity of the compressed electron layer $v_{\text{CEL}}$ and the steepness of the laser front $a_{0}/t_{\text{up}}$ according to Equation (5) for $n_{0}=50n_{\text{c}}$. (b) Evolutions of the velocity, $v_{\text{p}}$ (black solid line), and energy, $E_{\text{p}}$, of the proton layer during the HB stage.
    Distributions of (a)–(c) electric field $E_{y}$, (d)–(f) electron density $n_{\text{e}}$, (g)–(i) $\text{C}^{6+}$ density and (j)–(l) proton density at $t=21T$ (first row), $t=23T$ (second row) and $t=25T$ (third row).
    Fig. 3. Distributions of (a)–(c) electric field $E_{y}$, (d)–(f) electron density $n_{\text{e}}$, (g)–(i) $\text{C}^{6+}$ density and (j)–(l) proton density at $t=21T$ (first row), $t=23T$ (second row) and $t=25T$ (third row).
    (a) Trajectories of the $\text{C}^{6+}$ layer (black square), the proton layer (blue triangle) and the interface between the laser and the compressed electron layer (red circle). Enlarged plots of the trajectories are shown in (b). (c) Phase space distributions of $\text{C}^{6+}$ ions and protons at $t=25T$. (d) Energetic spectra for the proton layer in different initial regions at $t=25T$. Here, protons in the region $-3~\unicode[STIX]{x03BC}\text{m} are considered.
    Fig. 4. (a) Trajectories of the $\text{C}^{6+}$ layer (black square), the proton layer (blue triangle) and the interface between the laser and the compressed electron layer (red circle). Enlarged plots of the trajectories are shown in (b). (c) Phase space distributions of $\text{C}^{6+}$ ions and protons at $t=25T$. (d) Energetic spectra for the proton layer in different initial regions at $t=25T$. Here, protons in the region $-3~\unicode[STIX]{x03BC}\text{m} are considered.
    Rising-up duration of the laser front $t_{\text{up}}$ (red circle), energy (black square) and areal density (blue triangle) of the proton layer for different laser intensities calculated from Equations (3)–(5). Here the foil density is $n_{0}=50n_{\text{c}}$.
    Fig. 5. Rising-up duration of the laser front $t_{\text{up}}$ (red circle), energy (black square) and areal density (blue triangle) of the proton layer for different laser intensities calculated from Equations (3)–(5). Here the foil density is $n_{0}=50n_{\text{c}}$.
    Wenpeng Wang, Cheng Jiang, Shasha Li, Hao Dong, Baifei Shen, Yuxin Leng, Ruxin Li, Zhizhan Xu. Monoenergetic proton beam accelerated by single reflection mechanism only during hole-boring stage[J]. High Power Laser Science and Engineering, 2019, 7(3): 03000e55
    Download Citation