• Photonics Research
  • Vol. 8, Issue 6, 819 (2020)
Zhoujie Wu, Wenbo Guo, Yueyang Li, Yihang Liu, and Qican Zhang*
Author Affiliations
  • Department of Opto-Electronics, Sichuan University, Chengdu 610065, China
  • show less
    DOI: 10.1364/PRJ.389076 Cite this Article Set citation alerts
    Zhoujie Wu, Wenbo Guo, Yueyang Li, Yihang Liu, Qican Zhang. High-speed and high-efficiency three-dimensional shape measurement based on Gray-coded light[J]. Photonics Research, 2020, 8(6): 819 Copy Citation Text show less
    Schematic diagram of the high-speed measurement system.
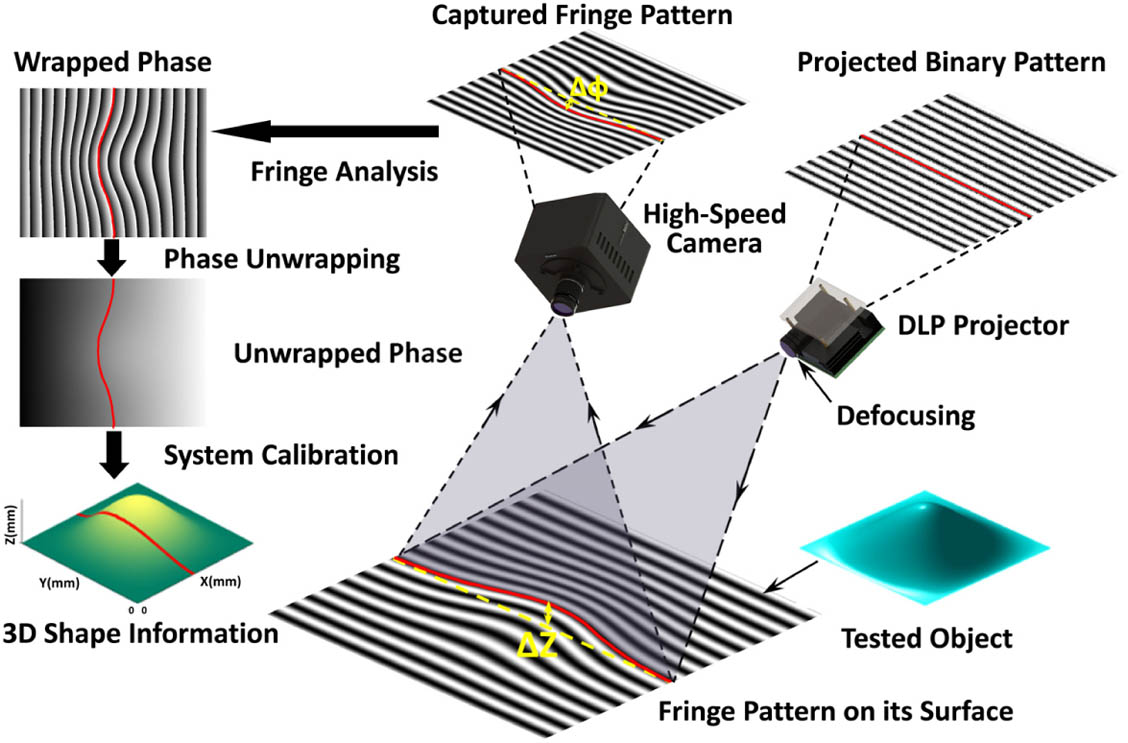
    Fig. 1. Schematic diagram of the high-speed measurement system.
    Cause of the jump errors of the Gray-code-based method in dynamic measurement. (a) Projected binary patterns. (b) Acquired gray-scale patterns after defocus and motion. (c) Mismatch between the wrapped phase and the phase order.
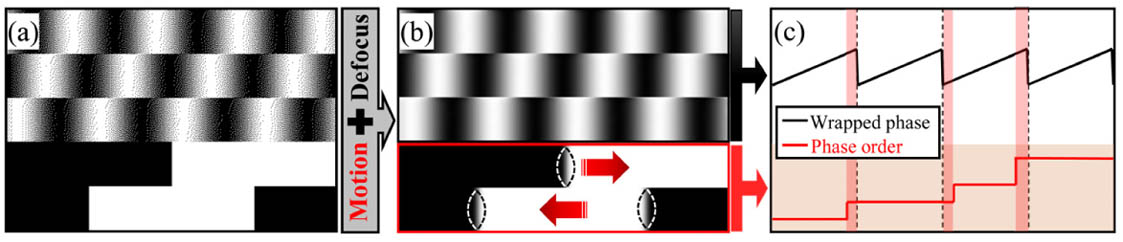
    Fig. 2. Cause of the jump errors of the Gray-code-based method in dynamic measurement. (a) Projected binary patterns. (b) Acquired gray-scale patterns after defocus and motion. (c) Mismatch between the wrapped phase and the phase order.
    Schematic diagram of the tripartite phase-unwrapping method. (a) Wrapped phase ϕ1 calculated from [I2,I3,I1]. (b) Wrapped phase ϕ2 calculated from [I1,I2,I3]. (c) Wrapped phase ϕ3 calculated from [I3,I1,I2]. (d) Phase compensation for ϕ1 and ϕ3. (e) Unwrapped phase.
    Fig. 3. Schematic diagram of the tripartite phase-unwrapping method. (a) Wrapped phase ϕ1 calculated from [I2,I3,I1]. (b) Wrapped phase ϕ2 calculated from [I1,I2,I3]. (c) Wrapped phase ϕ3 calculated from [I3,I1,I2]. (d) Phase compensation for ϕ1 and ϕ3. (e) Unwrapped phase.
    Schematic diagram of the regional division using reference wrapped phase.
    Fig. 4. Schematic diagram of the regional division using reference wrapped phase.
    Time-overlapping Gray-code coding strategy.
    Fig. 5. Time-overlapping Gray-code coding strategy.
    Framework of the proposed method. (a) Procedure of the proposed method. (b) Line profiles (located in red dotted line in the texture map) of the key data in (a).
    Fig. 6. Framework of the proposed method. (a) Procedure of the proposed method. (b) Line profiles (located in red dotted line in the texture map) of the key data in (a).
    Accuracy analysis of the proposed method. (a) Design drawing of the measured standard pieces. (b) Captured deformed fringe pattern. (c) Divided tripartite regions. (d) Reconstructed result. (e) Flatness error distribution. (f) Height difference of the steps. (g) Measured result and fitting sphere of the standard ball. (h) Error distribution of the standard ball.
    Fig. 7. Accuracy analysis of the proposed method. (a) Design drawing of the measured standard pieces. (b) Captured deformed fringe pattern. (c) Divided tripartite regions. (d) Reconstructed result. (e) Flatness error distribution. (f) Height difference of the steps. (g) Measured result and fitting sphere of the standard ball. (h) Error distribution of the standard ball.
    Comparative experiments on the anti-noise ability. (a)–(c) Captured deformed fringe images with different frequencies (fh=16, fl=1, and fm=15) and the intensity in line 480 of the corresponding images. (d) Captured deformed Gray-coded image and the intensity in line 480. (e) Texture map of the blocks. (f)–(h) Reconstructed results using the two-frequency, two-wavelength, and proposed methods, respectively.
    Fig. 8. Comparative experiments on the anti-noise ability. (a)–(c) Captured deformed fringe images with different frequencies (fh=16, fl=1, and fm=15) and the intensity in line 480 of the corresponding images. (d) Captured deformed Gray-coded image and the intensity in line 480. (e) Texture map of the blocks. (f)–(h) Reconstructed results using the two-frequency, two-wavelength, and proposed methods, respectively.
    Measurement on the dynamic scene of collapsing building blocks. (a) Captured pattern sequences. (b) Representative collapsing scenes. (c) Corresponding 3D frames (Visualization 1).
    Fig. 9. Measurement on the dynamic scene of collapsing building blocks. (a) Captured pattern sequences. (b) Representative collapsing scenes. (c) Corresponding 3D frames (Visualization 1).
    Measurement on the dynamic scene of rotating fan blades. (a) Reconstructed result at the time T=274.7 ms. (b) Captured image with low SNR. (c) Intensity distribution of the red dashed line in (b). (d) Five line profiles of the white dashed line in (a) at the time intervals of 31.3 ms. (e)–(h) Four results with the interval of a quarter turn (Visualization 2).
    Fig. 10. Measurement on the dynamic scene of rotating fan blades. (a) Reconstructed result at the time T=274.7  ms. (b) Captured image with low SNR. (c) Intensity distribution of the red dashed line in (b). (d) Five line profiles of the white dashed line in (a) at the time intervals of 31.3 ms. (e)–(h) Four results with the interval of a quarter turn (Visualization 2).
    Schematic diagram of the correction algorithm. (a) Schematic diagram of the errors occurring in the edge or shade regions. (b) Flowchart of the whole regional division algorithm.
    Fig. 11. Schematic diagram of the correction algorithm. (a) Schematic diagram of the errors occurring in the edge or shade regions. (b) Flowchart of the whole regional division algorithm.
    Measurement results (a) before and (b) after correction.
    Fig. 12. Measurement results (a) before and (b) after correction.
    Zhoujie Wu, Wenbo Guo, Yueyang Li, Yihang Liu, Qican Zhang. High-speed and high-efficiency three-dimensional shape measurement based on Gray-coded light[J]. Photonics Research, 2020, 8(6): 819
    Download Citation