Fringe projection profilometry has been increasingly sought and applied in dynamic three-dimensional (3D) shape measurement. In this work, a robust, high-efficiency 3D measurement based on Gray-coded light is proposed. Unlike the traditional method, a tripartite phase unwrapping method is proposed to avoid the jump errors on the boundary of code words, which are mainly caused by the defocusing of the projector and the motion of the tested object. Subsequently, the time-overlapping coding strategy is presented to greatly increase the coding efficiency, decreasing the projected number in each group from seven (i.e., ) to four (i.e., ) for one restored 3D frame. The combination of two proposed techniques allows the reconstruction of a pixel-wise and unambiguous 3D geometry of dynamic scenes with strong noise using every four projected patterns. To the best of our knowledge, the presented techniques for the first time preserve the high anti-noise ability of a method based on the Gray code while overcoming the drawbacks of jump errors and low coding efficiency. Experiments have demonstrated that the proposed method can achieve robust, high-efficiency 3D shape measurement of high-speed dynamic scenes even polluted by strong noise.
1. INTRODUCTION
Optical three-dimensional (3D) profilometry has been widely used for mechanical engineering, biological recognition, machine vision, intelligent manufacturing, and so on [1–3]. Among all measuring methods, fringe projection profilometry (FPP) is one of the research hotspots due to its high accuracy and flexibility. With recent rapid advancements on hardware equipment such as the high-speed camera and the digital light processing (DLP) projector [4–6], high-speed, accurate 3D shape measurement based on fringe projection has been increasingly sought by researchers.
The introduction of electronic imaging sensors based on the charge-coupled device (CCD) or complementary metal–oxide–semiconductor (CMOS) sensors has revolutionized high-speed photography, enabling capture rates of up to frames per second (fps) [7]. Recently, Gao et al. proposed a 2D dynamic imaging technique called compressed ultrafast photography (CUP), which can capture nonrepetitive time-evolving events at up to [8]. In addition, Nakagawa et al. presented the sequentially timed all-optical mapping photography (STAMP) that can perform single-shot image acquisition equally with short frame intervals () and high pixel resolution () [9]. On the other hand, using a digital micromirror device (DMD), a DLP platform (e.g., DLP Discovery, DLP Light Commander and DLP LightCrafter) can project the binary images at a fast rate (e.g., 20 kHz for DLP Discovery 4100). Combined with the binary defocusing technique [10], a high-quality sinusoidal fringe pattern can be generated and projected at a high-speed rate. Therefore, both the speeds of projection and capture are fast enough to reconstruct dynamic scenes. The remaining problem is how to find a suitable method to realize a robust, efficient high-speed 3D measurement.
Single-shot methods (e.g., de Bruijn sequences [11], M-arrays [12], and speckle pattern [13,14]) are suitable for dynamic measurement. All these methods need to wisely design the projected pattern to uniquely encode each pixel using its surrounding pixels; as a result, the spatial resolution and depth accuracy are limited. Phase calculation-based techniques are widely used because of their high accuracy. In the use of different analyzed domains to retrieve phase, phase calculation-based techniques can be categorized in two ways: the transform-based method [15–21] and the multiframe method [22–24]. Common transform methods include Fourier transform (FTP) [15–17], windowed Fourier transform [18,19], and wavelet transform [20,21]; and all of them analyze single fringe in spatial or frequency domains. FTP is the representative single-shot transform method, which is well-suited for high-speed 3D shape measurement. Since pattern switching is not required for the FTP method, the simpler optical projection system without the DMD or mechanical shifting units [25,26] can be designed for high-speed measurement. To the best of our knowledge, Zhang and Su first applied FTP in high-speed measurement [27]. They developed a projection system with a physical grating so that, theoretically, the reconstructed rate only depends on the maximum recording speed. Based on that system, they obtained the 3D shape and deformation of rotating blades using stroboscopic structured illumination [28] and achieved 3D reconstruction of the drumhead vibration at the rate of 1000 Hz [29]. To apply FTP in more dynamic scenes, Zuo et al. proposed micro Fourier transform profilometry [30], which can realize a 3D acquisition rate up to 10,000 fps. However, due to the limitation of the bandpass filtering, it is difficult for the FTP method to measure objects with sharp edges, abrupt change, or nonuniform reflectivity. In addition, all the transform methods must carefully choose parameters, such as the size and the localization of the filtering window or the scale of the wavelet to obtain the high-quality retrieved phase. Consequently, for transform methods, it is hard to realize automatic processing in complex dynamic scenes where the shape of the objects is time-varying.
Sign up for Photonics Research TOC. Get the latest issue of Photonics Research delivered right to you!Sign up now
Compared to transform methods, multiframe methods are used more widely in optical metrology because of the high precision, low complexity, and easy accomplishment under computer control. In multiframe methods, phase extracting is achieved in the temporal domain. A series of fringe patterns are projected onto the tested object surfaces at different instants and the phase for each given pixel of captured images can be independently calculated by the intensity values at that point over time. Hence, multiframe methods are insensitive to varying reflectivity. Among the multiframe methods, phase-shifting profilometry (PSP) [23,24,31] is most widely used.
In addition, the use of the arctangent function caused phase ambiguity in both FTP and PSP. So, the temporal phase unwrapping (TPU) algorithm [32] is applied to eliminate phase ambiguity and measure isolated or steep objects. Typical TPU approaches applied in dynamic 3D shape measurement can be classified into two categories: multifrequency (or multiwavelength) approaches [32–35] and approaches based on the Gray code [36,37]. Multifrequency approaches eliminate the phase ambiguity by projecting other groups of shifting fringe patterns. According to the different principles to eliminate the phase ambiguity, multifrequency approaches can be further divided into three types: the hierarchical approach [32,33], the heterodyne approach [34,35], and the number theoretical approach [38,39]. In high-speed 3D shape measurement, Wang and Zhang applied a multifrequency (heterodyne, ) phase-shifting technique with optimal pulse width modulation [40] to develop a 556 Hz measuring system. However, it cost nine patterns to reconstruct one result, which is relatively inefficient. Therefore, they used a two-frequency (hierarchical, ) technique [41] to measure the shape of a live rabbit heart. Then, Zuo et al. proposed a high-speed measuring method using a bifrequency (number-theoretical, ) tripolar pulse-width-modulation technique [42] to achieve 1250 Hz 3D measurement. All the traditional two-frequency TPU approaches suffer phase-unwrapping errors when frequency far higher than the low frequency is chosen [43]. To improve the period of high-frequency fringe patterns, Yin et al. applied depth constraint in the number theoretical method and improved the measuring accuracy at the cost of a limited measuring depth [44].
Approaches based on the Gray code eliminate phase ambiguity by projecting a series of binary Gray-coded patterns, and N patterns can uniquely label stripe periods. These approaches have been widely used in 3D shape measurement for static scenes because of the robustness and anti-noise ability. However, it is still challenging for these methods to realize a high-speed shape measurement. Two essential problems, jump errors and low coding efficiency, must be solved. Because of the object’s motion and the projector’s defocus, jump errors occur easily on the boundaries of the adjacent Gray-coded words. To overcome this drawback, Wang et al. combined the conventional spatial phase unwrapping with a Gray-coded method to solve the motion-induced phase-unwrapping errors [45]. This framework is great but only works well for simple, smooth objects. Laughner et al. projected an additional white image with all “1s” and a black image with all “0s” to binarize the Gray codes and restored the accurate rabbit cardiac deformation at 200 fps [46]. But 10 images are used to recover one 3D frame. Zheng et al. projected an additional binary pattern to construct the image with all “0.5s,” using the defocus of the projector [47]. Then the image with the “0.5” grayscale is used to binarize the Gray codes. However, the binarization reduced, but did not eliminate, the jump errors. Another correction, such as a median filter, was required to remove the remaining errors [48]. Wu et al. recoded Gray codes in temporal and spatial domains, respectively, realizing the simple and robust phase unwrapping in dynamic 3D shape measurement without projecting additional patterns [49,50]. On the other hand, methods based on the Gray code require many additional patterns for phase disambiguation (e.g., at least four patterns are needed to label 16 stripe periods). In our previous work [49,50], every three phase-shifting sinusoidal patterns and four Gray-coded patterns () are obtained to restore one 3D frame. To improve the coding efficiency, Zheng et al. proposed ternary and quaternary Gray-code-based phase-unwrapping methods using binary defocusing projection, in which several gray levels instead of black and white are used to encode the fringe period [51,52]. It acquires higher coding efficiency at the cost of reducing the signal-to-noise ratio. So, how to realize robust and high-coding-efficiency 3D shape measurement based on Gray-coded light in dynamic scenes is a problem that must be addressed.
To this end, a high-speed, high-efficiency 3D shape measurement method based on Gray codes is proposed. The tripartite phase-unwrapping method is proposed to avoid jump errors on the boundary of code words, which are mainly caused by defocusing and motion. Three staggered wrapped phases with a phase difference can be acquired just by changing the built-up sequence of captured sinusoidal patterns. And the reference wrapped phase is created to divide decoding orders into the tripartition. Hence, decoding orders in different regions are used to unwrap the corresponding wrapped phase, enabling nonuse of the wrapped phase in the jump regions. Thus, the jump errors can be pre-avoided without additional pattern projection. Subsequently, a time-overlapping Gray-code coding strategy is presented to greatly increase coding efficiency. Each of the traditional four Gray-coded patterns is projected after every three dithering sinusoidal patterns. Therefore, every Gray-coded pattern could be used four times to decrease the projected number in each group from seven (i.e., ) to four (i.e., ). The combination of two proposed techniques allows the reconstruction of a pixel-wise, unambiguous 3D geometry of dynamic scenes with every four projected patterns. The presented techniques preserve the high anti-noise ability of the Gray-code-based method while overcoming the drawbacks of jump errors and low coding efficiency. Finally, robust, high-efficiency 3D measurement has been achieved in high-speed dynamic scenes, even those polluted by strong noise.
2. PRINCIPLE
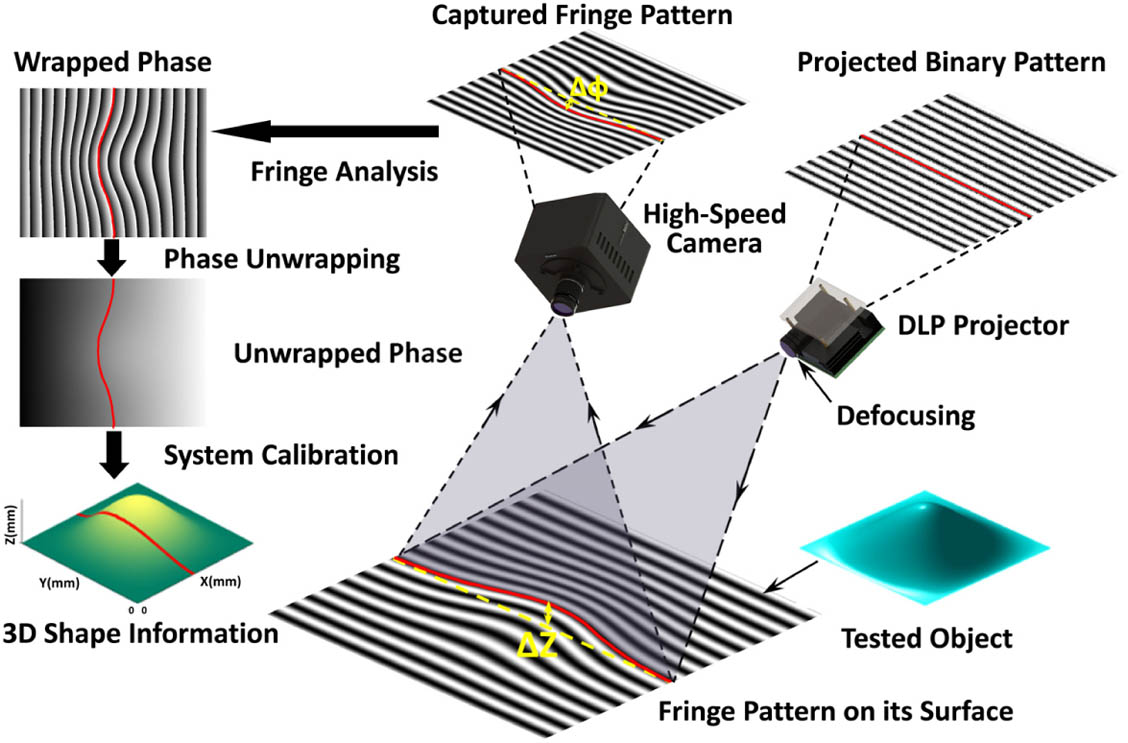
Our high-speed measurement system includes a DLP projector and a high-speed camera, as shown in Fig. 1. First, the projecting speed can be greatly increased by applying a binary defocusing technique [10] in which binary pseudo-sinusoidal patterns are projected by slightly defocusing the projection lens. Then, high-quality sinusoidal fringe is generated on the surface of objects, and the high-speed camera captures the deformed patterns in sync with the projector. Next, fringe analysis and phase-unwrapping algorithms are used to obtain the unambiguous phase. Finally, 3D shape information can be acquired through system calibration.
Figure 1.Schematic diagram of the high-speed measurement system.
A. Integration of Phase-Shifting Algorithm with Gray-Code Method
Either PSP or the Gray-code method (GCM) [53] can resolve 3D geometry. Integrating PSP with GCM brings together the advantages of both strategies (i.e., the high spatial resolution of PSM, plus the unambiguity and robustness of GCM [54]). Since at least three patterns are required to extract the phase in PSP, the three-step phase-shifting algorithm is widely used to reduce the measuring time and motion-induced errors in dynamic measurement. Three phase-shifting sinusoidal patterns can be described as in which, is the intensity of the background light, is the fringe contrast, and is the wrapped phase of the modulated light field that can be obtained using the three-step phase-shifting algorithm described in Eq. (2). In addition, is the initial phase value to match the wrapped phase with the Gray codes, so
The periodic nature of the sinusoidal patterns introduces phase ambiguity; hence, Gray-coded patterns are projected to label the fringe order and eventually eliminate phase ambiguity. In the traditional Gray-code-based TPU method, Gray-coded patterns can label a maximum fringe orders. And the phase order can be calculated using in which, denotes the th binarized Gray-coded pattern, is the decoding decimal number, and the function is used to look up the known unique relationship between and . For convenience, the stripe period is assumed as four, so two Gray-coded patterns are required to be projected to uniquely label the different regions shown in Fig. 2(a).
Figure 2.Cause of the jump errors of the Gray-code-based method in dynamic measurement. (a) Projected binary patterns. (b) Acquired gray-scale patterns after defocus and motion. (c) Mismatch between the wrapped phase and the phase order.
To achieve high-speed projection, the dithering technique [55] is applied to produce high-quality sinusoidal fringes by defocusing the projector, as shown in Fig. 2(a). However, the boundaries of the black and white value conversion of Gray-coded patterns are also blurred, as shown in Fig. 2(b), resulting in inaccurate binarization. Besides, the motion of the objects also brings in a shift among patterns. These two main factors will cause a mismatch between the wrapped phase and the phase order, as shown in Fig. 2(c). Therefore, jump errors easily occur on the boundaries of adjacent Gray-coded words. According to the Gray-coded design manner, the Hamming distance of two adjacent code words is 1, which makes the wrong orders on the boundaries only have one-order jump errors. It means that the phase-order map still remains stair-stepping, as shown in Fig. 2(c), which is the precondition of the proposed phase-unwrapping method described in the next subsection.
B. Tripartite Phase-Unwrapping Method
The jump errors on the boundaries will cause phase errors in the phase-unwrapping process. The existing methods to overcome this drawback can be classified into post-eliminated methods and pre-avoided methods. Among these methods, spatial phase unwrapping [45], pixel-wise binarization and filtering [46–48], or monotonicity detection [56] are the post-eliminated methods to detect and correct phase errors. These post-eliminated methods perform well in static scenes. But it is hard to apply these methods in dynamic measurement. Because the width of the error regions might be larger in dynamic scenes, making it difficult to distinguish the jump errors from the abrupt change of the object. Complementary and shifting Gray-code methods [49,50] are pre-avoided methods and achieved robust measurement for complex dynamic scenes by using Gray codes in adjacent projected sequences. But it confined the further promotion of the Gray-code coding efficiency in high-speed measurement. Therefore, in this subsection, a novel pre-avoided method named tripartite phase unwrapping (Tri-PU) is proposed.
Several staggered wrapped phases with a fixed phase difference can be acquired just by changing the built-up sequence of captured sinusoidal patterns [57]. As shown in Figs. 3(a)–3(c), three wrapped phases , , and can be calculated by applying different pattern sequences , , and in Eq. (2), respectively. In fact, the shift of the pattern sequences only changes the initial phase value with , causing the staggered discontinuity in three different wrapped phases. Hence, if the phase order can also be divided into three different regions (low part of ), (middle part of ), and (high part of ), as shown in the black rectangle of Fig. 3, the different parts of can be used to unwrap the corresponding parts in , , and , respectively. In this way, the boundaries of [gray-shaded area in Fig. 3(b)] that suffer the jump errors are used to unwrap the continuous parts of and to effectively avoid the jump errors. As shown in Fig. 3, the three parts of the are colored the same as the corresponding wrapped phases. So, as shown in Fig. 3(e), the phase ambiguity can be eliminated using Eq. (5), once the initial phase difference is compensated. The tripartite phase unwrapping strategy works well when the mismatch between the wrapped phase and the phase order is no more than a 1/3 fringe period, which is usually easy to guarantee in dynamic measurement, when
Figure 3.Schematic diagram of the tripartite phase-unwrapping method. (a) Wrapped phase calculated from . (b) Wrapped phase calculated from . (c) Wrapped phase calculated from . (d) Phase compensation for and . (e) Unwrapped phase.
It should be mentioned that the reason for the jump errors is the edge mismatch of the wrapped phase and the phase order. The common approach to solve this problem relies on the edge of the wrapped phase and corrects the edge of the phase order. However, in this work, the edges of the phase order are regarded as reliable, and the relatively unreliable discontinuities of the wrapped phase are avoided by shifting the position of the discontinuities. Therefore, in the next subsection, the region division of the phase order cannot rely on the edge of the wrapped phase , , and .
C. Regional Division Using Reference Wrapped Phase
To apply the proposed Tri-PU method, the phase order is acquired to be divided. Different from the wrapped phase, the phase order does not have monotonicity, but stays unique in every single order. The assisted information is acquired to divide every phase order into three parts. Therefore, we propose to use the artificially created reference wrapped phase to divide each class of the phase order into tripartition.
In fact, the mismatch between the wrapped phase and the phase order only occurs on the two boundaries (left and right) of each , as shown in Fig. 4, so the middle region can be easily found by the phase value of using
Figure 4.Schematic diagram of the regional division using reference wrapped phase.
Hence, the problem is simplified to distinguish the left low region and right high region of . The existing wrapped phases (, , and ) lose the monotonicity in the edge regions of . Therefore, an artificially created reference wrapped phase is created, so in which, is the absolute phase of a measured reference plane that is already determined once the measuring system has been set up and has been obtained in the calibration process, and is a created wrapped phase that has the same discontinuous positions with , as shown in Fig. 4. In this way, a phase map with monotonicity in every class of phase order can be acquired to help distinguish the remaining two regions of in each order. First, we define region (2N) for each fringe order where . Since is the absolute phase of measured reference plane rather than the object, changes out of the range of (, ], so the critical threshold of in is no longer zero and varies in different periods. Therefore, in is determined by finding the critical line , where has the minimum absolute value along axis in using
So, phase values of on the can be used as to determine the lower region and the higher region using
In most cases, the proposed regional division algorithm can perform well, but caused by the shadow and the edge of the tested objects, an incorrect regional division will occur in a few specific areas only with fringe information in the narrow width. Thus, a correction algorithm is presented to improve the robustness of the proposed method. The detailed information is discussed in Appendix A.
D. Time-Overlapping Gray-Code Coding Strategy
The proposed Tri-PU method can solve the jump errors problem in the Gray-code-based method without using additional patterns. In this work, the number of projected Gray codes is assigned as four to compromise the measuring accuracy and speed. However, seven patterns (three phase-shifting patterns and four Gray-coded patterns) must still be projected in every sequence, which is relatively inefficient compared to other methods used in high-speed measurement. Therefore, the time-overlapping Gray-code coding strategy is proposed in this subsection to significantly increase the coding efficiency of the Gray-code-based method in high-speed measurement.
As shown in Fig. 5, each of traditional four Gray-coded patterns is projected after every three dithering sinusoidal patterns rather than continuously projecting four patterns in every sequence. For one group of sinusoidal patterns, the adjacent four Gray-coded patterns are used to eliminate the phase ambiguity, as shown in Fig. 5. Therefore, every Gray-coded pattern could be used four times to greatly decrease the projected number in every projecting group from seven () to four (). And the pattern number between phase-shifting fringes decreased from four to one. It means the denser and more continuous reconstructed results can be obtained with the same frame rate of the hardware, which is helpful to analyze the faster dynamic scene.
The Gray-coded patterns are only used to eliminate the phase ambiguity rather than modulate the objects’ depth information. Phase-shifting patterns determine the final measuring accuracy and speed. For one thing, the time span in each group of phase-shifting patterns is not changed, so the measuring accuracy will not be affected. For another, the separation of the Gray-coded patterns indeed increases the time span of one projected sequence, but the symmetrical distribution of them can also share the burden of error occurrence and halve the width of the mismatching region to ensure robust phase unwrapping. In our method, the precondition to use the time-overlapping strategy is the high-speed hardware and our proposed Tri-PU method. In the high-speed 3D measurement, the projecting and capturing speeds are commonly set much higher (over several kHz) than that of the measured objects to ignore the motion-induced phase-shifting errors. In addition, the Tri-PU method has the threshold 1/3 fringe period ( phase difference). When the mismatch between the wrapped phase and the phase order is no more than 1/3 period, the Tri-PU strategy works well. Hence, in our method, the motion-induced disparity of the adjacent several phase-shifting patterns is small and the discontinuous projection of the Gray-coded patterns can be ignored compared to the threshold 1/3 period of the Tri-PU method.
E. System Calibration
To obtain the 3D surface information of the object, the absolute phase must be converted to the height using the phase-to-height algorithm [58]. To reconstruct the height, use where is the absolute phase value of the measured object, relative to the reference plane. Four planes that have known height distributions are measured. Then three unknown parameters , , and can be solved and saved as system parameters for future phase-to-height mapping.
The camera calibration technique proposed by Zhang [59] is widely adopted and used in computer vision, so it is implemented to calibrate the camera in our developed system.
3. EXPERIMENTS AND RESULTS
Experiments have been conducted to test the performance of our proposed method. A measuring system was developed, including a DLP projector (LightCrafter 4500) and a high-speed CCD camera (Photron FASTCAM Mini UX100). The projector resolution is pixels and the lens assembled to the camera has a focal length of 16 mm and an aperture of F/1.4. In all experiments, the image refresh rate of the projector was set at 2170 Hz and the period number of the projected sinusoidal fringes is 16. In addition, pixels of the projector are used to generate projected fringe patterns with a period of 70 pixels. The camera resolution was set at pixels and the camera was synchronized by a trigger signal from a projector.
A. Measurement on the Static Scene
In the first experiment, a cooling fan for the central processing unit and a portrait sculpture were measured using the proposed Tri-PU method and the traditional phase-unwrapping (Tra-PU) method to demonstrate the validity of the Tri-PU method and compare the performance of two methods. To clearly explain the complete Tri-PU method, its whole framework is illustrated in Fig. 6(a). First, three deformed phase-shifting patterns are acquired to calculate three staggered wrapped phases , , and with phase difference just by changing their built-up sequence, and four Gray-coded patterns are obtained to calculate the phase order . Then, the unwrapping phase of the reference plane and are used to create the reference wrapped phase using Eq. (7). Next, the three parts , , and can be accurately divided and labeled in every phase order using and . After a regional division, three wrapped phases (, , and ) and three divided regions (, , and ) are used to eliminate the phase ambiguity using the proposed Tri-PU method. In addition, and also are used to unwrap the wrapped phase using the Tra-PU method. Finally, two unambiguous phases are converted to the 3D results by the system calibration. The line profiles of the key data are shown in Fig. 6(b).
Figure 6.Framework of the proposed method. (a) Procedure of the proposed method. (b) Line profiles (located in red dotted line in the texture map) of the key data in (a).
The experimental results show the proposed Tri-PU method can well avoid the jump errors in the traditional Gray-code-based method without using additional projected patterns. In the shadow and edge areas, the correction algorithm in Tri-PU method works well, as shown in the subfigure of Fig. 6(a).
B. Accuracy Analysis
To quantitatively evaluate the accuracy of the measuring system, a standard ceramic ball and a designed step-shaped workpiece were measured, as shown in Fig. 7(a). The radius of the ceramic ball is 12.6994 millimeter (mm), which is measured by the coordinate measurement machine. The step height of the workpiece is designed to be 30 mm, and the machining error is less than 30 microns. One of the deformed fringe patterns and the divided regions are shown in Figs. 7(b) and 7(c). Then, the 3D result is reconstructed using the presented method, as shown in Fig. 7(d). First, the flatness of the measured four planes in the workpiece was evaluated. Four fitting planes on the restored result were treated as the ground truth and the error distribution of each step is shown in Fig. 7(e). The root-mean- square (RMS) errors of four measured planes are 0.0999 mm (Plane 1), 0.0685 mm (Plane 2), 0.0594 mm (Plane 3), and 0.0762 mm (Plane 4). Because the best defocusing level is in the middle region of the calibrated volume, the flatness of the planes in the middle region is better than that found at both ends.
Figure 7.Accuracy analysis of the proposed method. (a) Design drawing of the measured standard pieces. (b) Captured deformed fringe pattern. (c) Divided tripartite regions. (d) Reconstructed result. (e) Flatness error distribution. (f) Height difference of the steps. (g) Measured result and fitting sphere of the standard ball. (h) Error distribution of the standard ball.
Then, the measured accuracy in Z axis was evaluated. The fitting plane of the Plane 1 was treated as the base plane, and the height difference of the step is shown in Fig. 7(f). The mean of height on each plane is 0.0002 mm (Plane 1), 30.0054 mm (Plane 2), 59.9867 mm (Plane 3), and 89.9003 mm (Plane 4). Finally, the measured accuracy in the whole volume was evaluated by measuring the standard ceramic ball. As shown in Fig. 7(g), the sphere fitting on the reconstructed 3D geometry of the ceramic ball is performed, and the measured radius of the ball is 12.7083 mm and the RMS error of the ball is 0.0767 mm. The error distribution of the ball is shown in Fig. 7(h). These results show that the presented system can achieve a measurement accuracy better than 0.1 mm in the measurement volume size of .
C. Measurement on Complex Dynamic Scenes with Low SNR
1. Collapsing Building Blocks
In this experiment, the dynamic process during which building blocks are torn down by a hand was measured to verify the performance of the proposed method in the complex dynamic scene with a low signal-to-noise ratio (SNR). Without spraying the high reflectivity paint on the object’s surface, the building blocks have different reflectivity, texture, and lots of scratches on their surfaces, as shown in Fig. 8(e). So, it is a scene with low SNR as shown in Figs. 8(a)–8(d) for the fringe projection technique. First, a contrast experiment was performed to compare the anti-noise ability of the proposed method, the two-frequency method [32], and the two-wavelength method [34]. Three groups of three-step dithering phase-shifting patterns with different frequencies (, , and ) and four Gray-coded patterns are projected and captured, as shown in Figs. 8(a)–8(d). Then, three height distributions are reconstructed using the two-frequency, the two-wavelength, and the proposed methods, respectively, as shown in Figs. 8(f)–8(h). The data indicates that most phase-unwrapping errors (error rate: 2.02%, which is the ratio between the numbers of error points and valid points) occurred in the result using the two-wavelength method, some errors (error rate: 1.46%) occurred in the two-frequency method, and no errors occurred in the proposed method. This experiment shows the proposed method has higher anti-noise ability than the two-frequency and two-wavelength methods using the binary defocusing technique. In the two-frequency method, the optimal defocused degree cannot be ensured for the unit-frequency sinusoidal pattern because high-frequency sinusoidal patterns are optimally defocused to pursue higher measuring accuracy, and hence the phase quality of the unit-frequency fringe is relatively low. In the two-wavelength method, the heterodyne algorithm increases the unambiguous measurement range by sacrificing its SNR, so this method is sensitive to the noise. Error rates increase with the ratio between two fringe frequencies in the two-frequency and two-wavelength methods [43]. In the proposed method, however, the error rate is independent of the fringe frequency because Gray codes that only have two gray scales are used to eliminate phase unambiguity and only the Gray codes are used in the decoding process. In addition, the presented tripartite phase unwrapping method is used to avoid errors at the transition area between black and white codes, so the proposed method can restore the low-SNR scene without phase-unwrapping errors. This comparative experiment shows the proposed method has better anti-noise ability and robustness than the two-frequency and two-wavelength methods in the scenes with low SNR when using the binary defocusing technique for high-speed measurement.
Figure 8.Comparative experiments on the anti-noise ability. (a)–(c) Captured deformed fringe images with different frequencies (, , and ) and the intensity in line 480 of the corresponding images. (d) Captured deformed Gray-coded image and the intensity in line 480. (e) Texture map of the blocks. (f)–(h) Reconstructed results using the two-frequency, two-wavelength, and proposed methods, respectively.
After proof of the high anti-noise ability of the proposed method, the proposed method was applied to measure the dynamic collapsing process of this high-noise scene. Three-layer building blocks were torn down by a hand. As shown in Fig. 9(a), the proposed time-overlapping Gray-code coding strategy is used to greatly improve the coding efficiency. Therefore, the proposed method allows the reconstruction of a 3D geometry of dynamic scenes with every four projected patterns. The texture map (average intensity of the three phase-shifting fringe images) and corresponding high-quality results at different moments are shown in Figs. 9(b) and 9(c) and Visualization 1. The reconstructed rate is and the replayed rate is 30 fps. Experimental results show that the proposed method can achieve robust measurement in the complex and dynamic scene, while guaranteeing high coding efficiency.
Figure 9.Measurement on the dynamic scene of collapsing building blocks. (a) Captured pattern sequences. (b) Representative collapsing scenes. (c) Corresponding 3D frames (Visualization 1).
In the last experiment, rotating fan blades were measured to further validate the high anti-noise ability. With the dense speckle spraying on the blade surface, strong noise occurs in images, as shown in Fig. 10(b). Hence, the acquired fringe image also has low SNR, as shown in Fig. 10(c). The rotation of the blades was driven by the wind from the opposite fan, so blades rotated counterclockwise. The reconstructed 3D frame at the time () is shown in Fig. 10(a). Five profiles in the white dashed line of Fig. 10(a) at time intervals of 31.3 ms are given in Fig. 10(d), which shows the height-varied process when a piece of blade rotates across one line. Furthermore, four results with every revolution of 90 degrees are given to evaluate the rotating speed, as shown in Figs. 10(e)–10(h). The time intervals (265.5 ms, 243.3 ms, and 206.4 ms) decrease progressively, which indicates the fan is in the speed-up phase and the average rotation speed is about 64 rotations per minute during this process. The corresponding 3D video is shown in Visualization 2. The reconstructed rate is and the replayed rate is 60 fps.
Figure 10.Measurement on the dynamic scene of rotating fan blades. (a) Reconstructed result at the time . (b) Captured image with low SNR. (c) Intensity distribution of the red dashed line in (b). (d) Five line profiles of the white dashed line in (a) at the time intervals of 31.3 ms. (e)–(h) Four results with the interval of a quarter turn (Visualization 2).
Our proposed method has the following advantages compared to other high-speed 3D measurement techniques.
A. High Robustness and Anti-Noise Ability in Phase Unwrapping
Compared to the two-frequency method or the two-wavelength method, the Gray-code-based method only projects high-frequency, phase-shifting patterns. Hence, the optimum defocusing degree in the binary dithering technique can be guaranteed. And Gray-coded patterns that only have two gray scales are used to eliminate phase ambiguity in the decoding process. So, the phase-unwrapping error rate is independent of the frequency of sinusoidal fringes and the noise will not be amplified in phase-unwrapping process. Based on these merits, the Gray-code-based method has better anti-noise ability compared to the two-frequency and two-wavelength methods in high-speed measurement. In addition, the presented Tri-PU method is used to avoid errors at the transition area between black and white codes and guarantee high robustness. So, by combining the Gray-code-based method and the Tri-PU method, the proposed method can realize the high robustness and anti-noise phase unwrapping in dynamic scenes. It should be mentioned that the proposed Tri-PU method also can be applied in other fringe projection techniques to solve the problem of jump errors. Once the staggered wrapped phase and phase order are demodulated by other existing fringe projection profilometry approaches, the procedure to apply the Tri-PU method is the same as the Gray-code-based method in this work.
B. High-Efficiency Coding Strategy in High-Speed Dynamic Measurement
Low coding efficiency is the primary drawback of the Gray-code-based method in high-speed measurement. Thanks to high-speed hardware and the proposed Tri-PU method, however, the proposed time-overlapping strategy has been used to greatly improve coding efficiency. The number of projected patterns is reduced from seven to four in every sequence and a pixel-wise and unambiguous 3D geometry of dynamic scenes can be restored with every four projected patterns. Compared to the widely used two-frequency and two-wavelength methods, the separation of the Gray codes will not decrease the phase unwrapping success rate. So, to label no more than 16 stripe periods, the proposed method has a higher coding efficiency than either the two-frequency method or the two-wavelength method. However, to label the dense fringe pattern, the two-frequency and two-wavelength methods have higher coding efficiency because no extra patterns are projected. The phase-unwrapping error rate, however, will increase with the rising ratio of two fringe frequencies. For the proposed method, the error rate is independent of the fringe frequency. So, when the coding period increases, the error rate of the proposed method will not rise, despite projecting additional patterns.
C. Robust and High-Efficiency 3D Shape Measurement in Complex Dynamic Scenes with Low SNR
With the proposed Tri-PU method and the time-overlapping strategy, robust and high-efficiency 3D shape measurement can be achieved in complex dynamic scenes with low SNR. The proposed method preserves the high anti-noise ability of the traditional Gray-code-based method while overcoming the drawbacks of the jump errors and low coding efficiency.
5. CONCLUSION
In this study, high-speed, high-efficiency 3D measurement based on Gray-coded light has been proposed. The Tri-PU method avoids the jump errors on the boundary of code words, which are mainly caused by defocusing and motion. Three staggered wrapped phases with phase difference can be acquired just by changing the built-up sequence of captured sinusoidal patterns. And the reference wrapped phase is created to divide each class of the phase order into the tripartition. Then decoding orders in different regions are used to unwrap the corresponding wrapped phase, enabling the middle part of the wrapped phase in the border jump regions. Hence, the jump errors can be pre-avoided rather than post-eliminated without additional pattern projection. Subsequently, the time-overlapping coding strategy is presented to greatly increase the coding efficiency, decreasing the projected number in each group from seven to four. The combination of two proposed techniques allows the reconstruction of a pixel-wise and unambiguous 3D geometry of dynamic scenes with strong noise using every four projected patterns. To the best of our knowledge, the presented techniques can preserve for the first time the high anti-noise ability of the Gray-code-based method while overcoming the drawback of jump errors and low coding efficiency. Experiments have demonstrated that the proposed method can achieve robust, high-efficiency 3D measurement of high-speed dynamic scenes with low SNR at a rate of 542 fps.
Acknowledgment
Acknowledgment. The authors would like to express sincere gratitude to Prof. Xianyu Su for his encouragement and helpful discussion.
APPENDIX A: DETAILED PROCEDURE OF REGIONAL DIVISION ALGORITHM WITH ERROR CORRECTION
In actual measurement, the phase information in the whole period cannot be completely acquired in the shadow or the edge area. As shown in Fig. 11(a), once these areas exceed the area where , the critical line may occur on the edge of each phase order , which is labeled by a red dot, and will cause the incorrect regional division. Hence, the correction algorithm is required, in which the points of that appear in will be replaced with the point where reaches the local minimum value out of , which is labeled by a yellow dot. To clearly illustrate the whole procedure of the regional division algorithm with the correction operation, a flowchart is plotted, as shown in Fig. 11(b).
Figure 11.Schematic diagram of the correction algorithm. (a) Schematic diagram of the errors occurring in the edge or shade regions. (b) Flowchart of the whole regional division algorithm.
[7] Y. Kondo, K. Takubo, H. Tominaga, R. Hirose, N. Tokuoka, Y. Kawaguchi, Y. Takaie, A. Ozaki, S. Nakaya, F. Yano, T. Daigen. Development of ‘HyperVision HPV-X’ high-speed video camera. Shimadzu Rev., 69, 285-291(2012).
[12] H. Morita, K. Yajima, S. Sakata. Reconstruction of surfaces of 3-D objects by M-array pattern projection method. Second International Conference on Computer Vision, 468-473(1988).