• Acta Optica Sinica
  • Vol. 42, Issue 23, 2328002 (2022)
Jiayi Xie1, Guoshuai Su1, Mingyu Li1、*, and JianJun He2
Author Affiliations
  • 1Department of Optical Engineering, School of Opto-Electronic Engineering, Changchun University of Science and Technology, Changchun 130022, Jilin , China
  • 2State Key Laboratory of Modern Optical Instrumentation, Zhejiang University, Hangzhou 310027, Zhejiang , China
  • show less
    DOI: 10.3788/AOS202242.2328002 Cite this Article Set citation alerts
    Jiayi Xie, Guoshuai Su, Mingyu Li, JianJun He. Temperature Sensor Cascading Reflective Fabry-Perot Cavity with Microring Resonator[J]. Acta Optica Sinica, 2022, 42(23): 2328002 Copy Citation Text show less
    Schematic diagram of intensity interrogation device based on temperature sensor
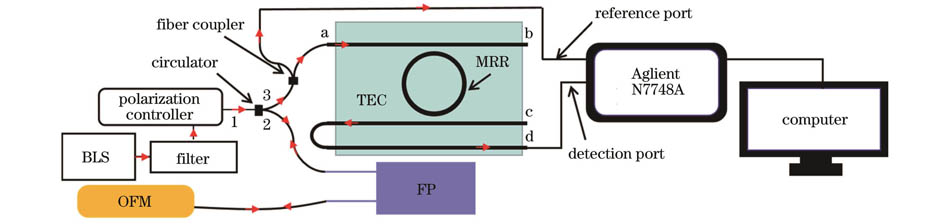
    Fig. 1. Schematic diagram of intensity interrogation device based on temperature sensor
    Principle of intensity interrogation method based on temperature sensor. (a) Input spectrum of BLS and transmission spectrum at ΔT=0; (b) output spectrum of temperature sensor at ΔT=0; (c) input spectrum of BLS and transmission spectrum at ΔT>0; (d) output spectrum of temperature sensor at ΔT>0
    Fig. 2. Principle of intensity interrogation method based on temperature sensor. (a) Input spectrum of BLS and transmission spectrum at ΔT=0; (b) output spectrum of temperature sensor at ΔT=0; (c) input spectrum of BLS and transmission spectrum at ΔT>0; (d) output spectrum of temperature sensor at ΔT>0
    Relationship between output power ratio of intensity interrogation method and temperature change
    Fig. 3. Relationship between output power ratio of intensity interrogation method and temperature change
    Output power ratio varying with temperature under different differences between FP etalon free spectral range and MRR free spectral range
    Fig. 4. Output power ratio varying with temperature under different differences between FP etalon free spectral range and MRR free spectral range
    Experimental setup for temperature sensor and optical microscope diagram of MRR. (a) Experimental setup for temperature sensor; (b) main part of experimental setup for temperature sensor; (c) optical microscope diagram of MRR
    Fig. 5. Experimental setup for temperature sensor and optical microscope diagram of MRR. (a) Experimental setup for temperature sensor; (b) main part of experimental setup for temperature sensor; (c) optical microscope diagram of MRR
    Transmission spectrum of temperature sensor and spectrum of combined light source
    Fig. 6. Transmission spectrum of temperature sensor and spectrum of combined light source
    Data points of intensity interrogation and fitting curve
    Fig. 7. Data points of intensity interrogation and fitting curve
    P2/P1 value varying with time at temperature of 26 ℃
    Fig. 8. P2/P1 value varying with time at temperature of 26 ℃
    Temperature /℃P2/P1 in 1st experiment /dBP2/P1 in 2nd experiment /dBP2/P1 in 3rd experiment /dBVariance /(10-5 dB)
    20.0-26.368-26.372-26.3631.4
    20.5-26.785-26.779-26.7675.6
    21.0-27.359-27.351-27.3727.5
    21.5-26.824-26.832-26.85719.6
    22.0-26.241-26.250-26.2638.2
    22.5-25.051-25.056-25.0749.7
    23.0-24.320-24.306-24.3315.0
    23.5-23.295-23.289-23.25313.8
    24.0-22.284-22.287-24.2674.2
    24.5-21.847-21.860-21.8583.3
    25.0-21.353-21.358-21.3472.0
    25.5-21.770-21.761-21.7806.0
    26.0-22.310-22.290-22.3067.5
    Table 1. Values and variances of P2/P1 detected in three experiments
    Experiment No.12345
    P2P1 /dB-26.368-26.372-26.363-26.359-26.375
    Table 2. P2/P1 values detected in five experiments at temperature of 20 ℃
    Jiayi Xie, Guoshuai Su, Mingyu Li, JianJun He. Temperature Sensor Cascading Reflective Fabry-Perot Cavity with Microring Resonator[J]. Acta Optica Sinica, 2022, 42(23): 2328002
    Download Citation