• Photonics Research
  • Vol. 7, Issue 7, 754 (2019)
Dae Seok Han and Myeong Soo Kang*
Author Affiliations
  • Department of Physics, Korea Advanced Institute of Science and Technology (KAIST), Daejeon 34141, South Korea
  • show less
    DOI: 10.1364/PRJ.7.000754 Cite this Article Set citation alerts
    Dae Seok Han, Myeong Soo Kang. Reconfigurable generation of optical vortices based on forward stimulated intermodal Brillouin scattering in subwavelength-hole photonic waveguides[J]. Photonics Research, 2019, 7(7): 754 Copy Citation Text show less
    (a) Schematic diagram of optical vortex (OV) generation based on forward stimulated intermodal Brillouin scattering. A circularly polarized fundamental mode (a1) and a higher-order hybrid mode (a2) drive a coherent acoustic vortex (AV) (b), which in turn transforms the incident signal (a3) in the circularly polarized fundamental mode into the OV beam (a4). (b) Vector diagram describing the angular momentum conservation in this process.
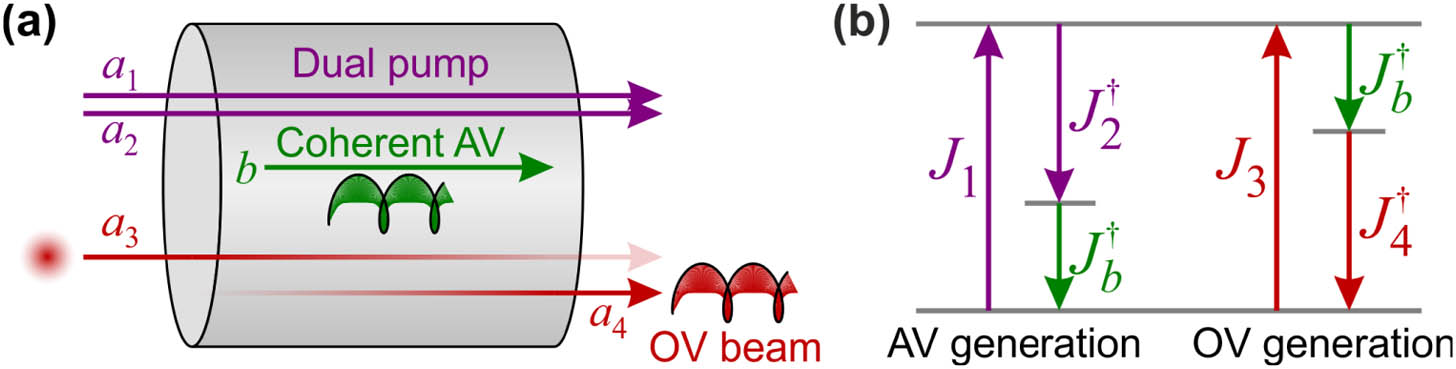
    Fig. 1. (a) Schematic diagram of optical vortex (OV) generation based on forward stimulated intermodal Brillouin scattering. A circularly polarized fundamental mode (a1) and a higher-order hybrid mode (a2) drive a coherent acoustic vortex (AV) (b), which in turn transforms the incident signal (a3) in the circularly polarized fundamental mode into the OV beam (a4). (b) Vector diagram describing the angular momentum conservation in this process.
    (a) Silica-glass subwavelength-hole waveguide (SWHW) suspended in the air, together with the Cartesian coordinates. (b) Intensity profiles of the circularly polarized fundamental mode and the three lowest-order optical vortex modes (OVMs), together with the corresponding compositions of the conventional even/odd hybrid modes for λ=1550 nm, Rin=1.2 μm, and Rout=3.0 μm. The light blue arrows represent the electric field distributions for the hybrid modes and the polarization states of the transverse electric fields for the OVMs. The rightmost column corresponds to the phase pattern of the x component of the electric field, arg(Ex).
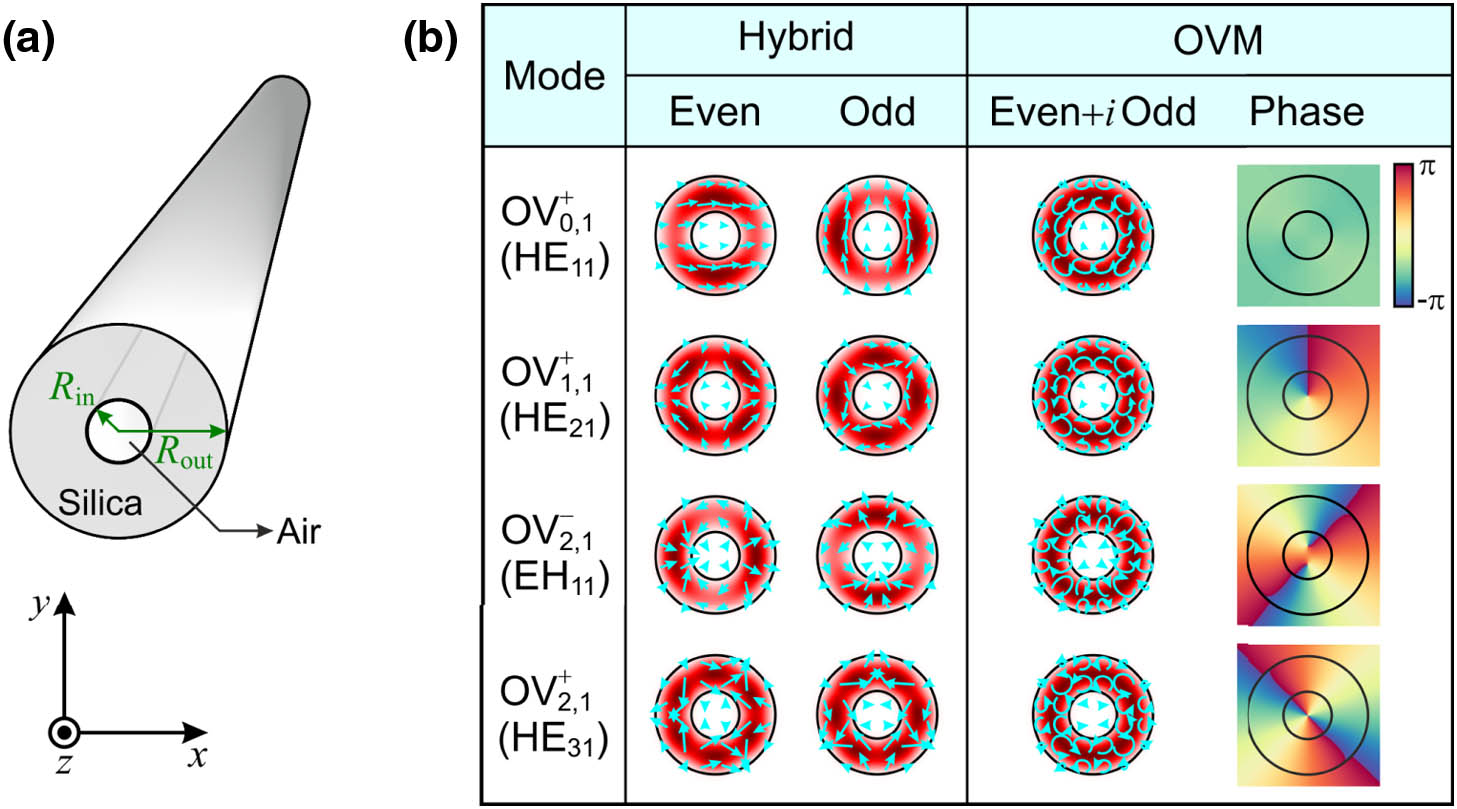
    Fig. 2. (a) Silica-glass subwavelength-hole waveguide (SWHW) suspended in the air, together with the Cartesian coordinates. (b) Intensity profiles of the circularly polarized fundamental mode and the three lowest-order optical vortex modes (OVMs), together with the corresponding compositions of the conventional even/odd hybrid modes for λ=1550  nm, Rin=1.2  μm, and Rout=3.0  μm. The light blue arrows represent the electric field distributions for the hybrid modes and the polarization states of the transverse electric fields for the OVMs. The rightmost column corresponds to the phase pattern of the x component of the electric field, arg(Ex).
    (a) Dispersion curves for the acoustic modes with the lowest radial mode number (m=1) in silica-glass SWHWs. The red, purple, and blue curves represent the acoustic modes with the three lowest azimuthal mode numbers, l=0, 1, and 2, respectively. The frequencies and wavevectors of the acoustic modes are in units of VL/Rout and π/Rout, respectively, where VL=5.972 km/s is the longitudinal sound velocity in fused silica. Some examples of the phase-matched acoustic modes are marked with green filled circles. (b) Displacement distributions of the longitudinal L01 (A), radial R01 (B), flexural F11 (C), and torsional-radial TR21 (D) acoustic modes, together with the resulting acoustic vortex modes (AVMs). The solid and dashed curves represent the deformed and undeformed boundaries, respectively, and the color map is used to describe the profile of the magnitude of total displacement. All the calculations in (a) and (b) are carried out at the wavelength of λ=1550 nm and for the SWHW parameters of Rin=1.2 μm and Rout=3.0 μm. See Visualization 1 and Visualization 2, which display the vibrational motions of the AV1,1 and AV2,1 modes, respectively.
    Fig. 3. (a) Dispersion curves for the acoustic modes with the lowest radial mode number (m=1) in silica-glass SWHWs. The red, purple, and blue curves represent the acoustic modes with the three lowest azimuthal mode numbers, l=0, 1, and 2, respectively. The frequencies and wavevectors of the acoustic modes are in units of VL/Rout and π/Rout, respectively, where VL=5.972  km/s is the longitudinal sound velocity in fused silica. Some examples of the phase-matched acoustic modes are marked with green filled circles. (b) Displacement distributions of the longitudinal L01 (A), radial R01 (B), flexural F11 (C), and torsional-radial TR21 (D) acoustic modes, together with the resulting acoustic vortex modes (AVMs). The solid and dashed curves represent the deformed and undeformed boundaries, respectively, and the color map is used to describe the profile of the magnitude of total displacement. All the calculations in (a) and (b) are carried out at the wavelength of λ=1550  nm and for the SWHW parameters of Rin=1.2  μm and Rout=3.0  μm. See Visualization 1 and Visualization 2, which display the vibrational motions of the AV1,1 and AV2,1 modes, respectively.
    Real and imaginary parts of the typical optical force distributions for the three types of angular momentum (AM) transfer processes, PROC1, PROC2, and PROC3, which involve different higher-order hybrid optical modes: HE21, EH11, and HE31 modes, respectively. All the calculations are performed at the wavelength of λ=1550 nm and for the SWHW parameters of Rin=1.2 μm and Rout=3.0 μm. In addition, the photoelastic coefficients are set as p11=0.121 and p12=0.270. For the electrostriction body force, the blue color intensities and black arrows depict the magnitude and direction, respectively, of the optical force. The optical boundary force is composed of the electrostriction force f(es) (blue) and radiation pressure f(rp) (red), where their magnitude and direction are plotted by the arrows in the same scale for all the three processes for comparison. We choose a particular global phase in such a way that the longitudinal component of the total electric field in the waveguide is purely real.
    Fig. 4. Real and imaginary parts of the typical optical force distributions for the three types of angular momentum (AM) transfer processes, PROC1, PROC2, and PROC3, which involve different higher-order hybrid optical modes: HE21, EH11, and HE31 modes, respectively. All the calculations are performed at the wavelength of λ=1550  nm and for the SWHW parameters of Rin=1.2  μm and Rout=3.0  μm. In addition, the photoelastic coefficients are set as p11=0.121 and p12=0.270. For the electrostriction body force, the blue color intensities and black arrows depict the magnitude and direction, respectively, of the optical force. The optical boundary force is composed of the electrostriction force f(es) (blue) and radiation pressure f(rp) (red), where their magnitude and direction are plotted by the arrows in the same scale for all the three processes for comparison. We choose a particular global phase in such a way that the longitudinal component of the total electric field in the waveguide is purely real.
    Color maps displaying the 3 dB coupling length ζ in silica-glass SWHWs over a range of Rout and M≡Rin/Rout for (a) PROC1, (b) PROC2, and (c) PROC3, where the pink curves indicate the cutoff of the HE21, EH11, and HE31 mode, respectively. The contour plots on top of the color maps show the minimum Δneff between the adjacent vector modes, i.e., among the TE01, TM01, and HE21 modes for (a), and between the EH11 and HE31 modes for (b) and (c). The black curves correspond to the power fraction p=85% in the waveguide core. The OVMs have lower confinement losses over the regions below the black curves.
    Fig. 5. Color maps displaying the 3 dB coupling length ζ in silica-glass SWHWs over a range of Rout and MRin/Rout for (a) PROC1, (b) PROC2, and (c) PROC3, where the pink curves indicate the cutoff of the HE21, EH11, and HE31 mode, respectively. The contour plots on top of the color maps show the minimum Δneff between the adjacent vector modes, i.e., among the TE01, TM01, and HE21 modes for (a), and between the EH11 and HE31 modes for (b) and (c). The black curves correspond to the power fraction p=85% in the waveguide core. The OVMs have lower confinement losses over the regions below the black curves.
    Spatial evolution of the optical and acoustic powers in PROC1 in silica-glass SWHW with (Rout,M)=(3 μm,0.4). (a) Optical and acoustic powers as functions of the propagation distance, z, at zero signal frequency detuning Δω13≡ω1−ω3=0. P1 and P2 are normalized to P0=1 W, P3 and P4 to P30=1 mW, and Pb to |b(z=0)|2. (b) Mode conversion efficiency P4(zmax)/P30 after propagation along zmax=3 m, where the optical dispersions of the silica-glass SWHWs are taken into account. (c) Same plots as (a) but at the different signal frequency detuning Δω13=10 GHz with different input pump power ratios of P10:P20=1:3 (dashed curves) and P10:P20=3:1 (solid curves). (d) Mode conversion efficiency at the optimum waveguide length P4(zopt)/P30, where zopt is the propagation length at which P4(z) is maximized.
    Fig. 6. Spatial evolution of the optical and acoustic powers in PROC1 in silica-glass SWHW with (Rout,M)=(3  μm,0.4). (a) Optical and acoustic powers as functions of the propagation distance, z, at zero signal frequency detuning Δω13ω1ω3=0. P1 and P2 are normalized to P0=1  W, P3 and P4 to P30=1  mW, and Pb to |b(z=0)|2. (b) Mode conversion efficiency P4(zmax)/P30 after propagation along zmax=3  m, where the optical dispersions of the silica-glass SWHWs are taken into account. (c) Same plots as (a) but at the different signal frequency detuning Δω13=10  GHz with different input pump power ratios of P10:P20=1:3 (dashed curves) and P10:P20=3:1 (solid curves). (d) Mode conversion efficiency at the optimum waveguide length P4(zopt)/P30, where zopt is the propagation length at which P4(z) is maximized.
    Dae Seok Han, Myeong Soo Kang. Reconfigurable generation of optical vortices based on forward stimulated intermodal Brillouin scattering in subwavelength-hole photonic waveguides[J]. Photonics Research, 2019, 7(7): 754
    Download Citation