
Chao Feng, Yi Jiang, Xiaomeng Zhao. Micro Defect Detection of Steel Ball Surface Based on Spatial Omni-Directional Light Source[J]. Laser & Optoelectronics Progress, 2022, 59(2): 0212002
- Laser & Optoelectronics Progress
- Vol. 59, Issue 2, 0212002 (2022)
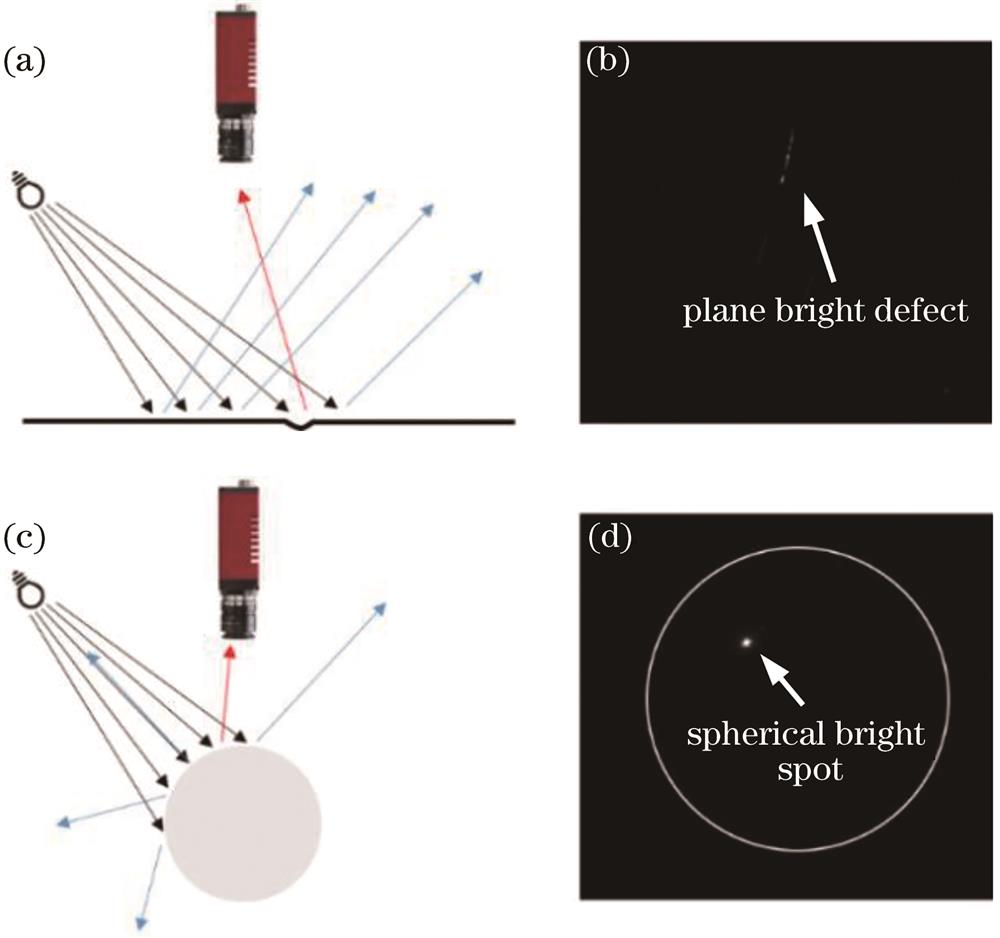
Fig. 1. Illumination diagrams. (a) (b) Plane illumination diagrams; (c) (d) spherical illumination diagrams
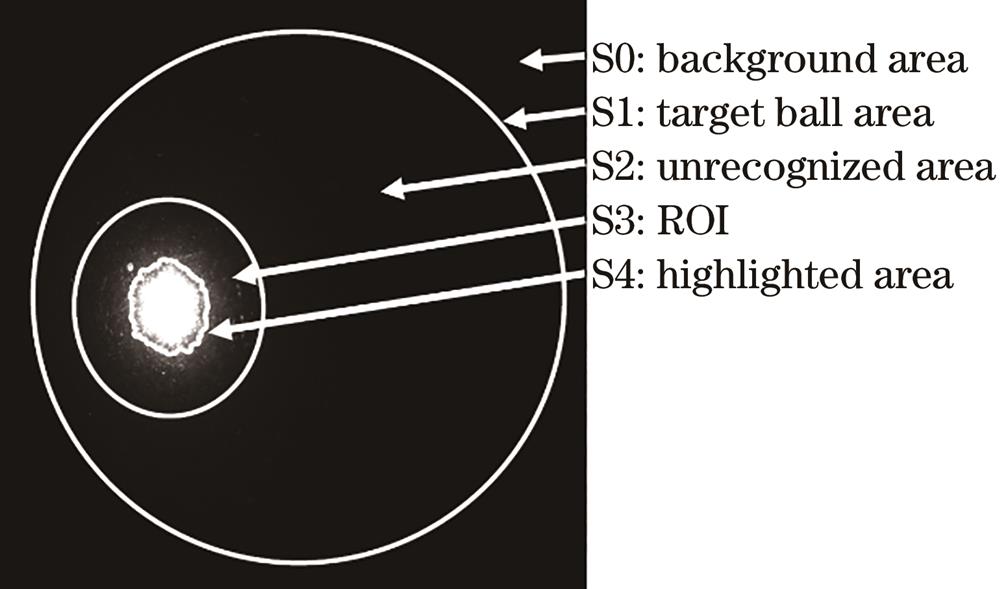
Fig. 2. Schematic diagram of steel ball surface area division
Fig. 3. Highlight of same scratch defect by different lighting. (a) Effect of regional lighting; (b) effect of strip lighting
Fig. 4. Spatial omni-directional light source model
Fig. 5. Image processing. (a) Filtering and noise reduction; (b) image segmentation; (c) image difference (reverse color); (d) image fusion (reverse color); (e) defect extraction (reverse color); (f) defect classification
Fig. 6. Detection system and target detection steel ball. (a) Detection system; (b) target detection steel ball
Fig. 7. Annular lighting scheme and regional lighting scheme. (a) Example of annular lighting scheme; (b) example of regional lighting scheme
Fig. 8. Schematic diagram of illumination area of annular scanning illumination
Fig. 9. Schematic diagram of effective detection area overlay
Fig. 10. Influence of noise segmentation threshold Td on defect extraction. (a) Td=10; (b) Td=50; (c) Td=30
Fig. 11. Result of grid search optimal double threshold
Fig. 12. Detection results of micro defects on surface of steel balls. (a) (e) Shallow scratch defect; (b) (f) pit defect; (c) (g) striation defect; (d) (h) spot defect
Fig. 13. Comparison of defect detection effects in different positions of same defect. (a)-(c) Position 1;(d)-(f) position 2
Fig. 14. Comparison of defect highlighting ability between annular lighting and regional lighting. (a) Illumination experiment of same micro striation; (b) illumination experiment of same micro scratch
Fig. 15. Schematic diagram of illuminated area after lighting scheme optimization
Fig. 16. Comparison of same defect extraction effects before and after lighting scheme optimization. (a) Defect image information; (b) extraction effect before optimization; (c) extraction effect after optimization
|
Table 1. Spherical distribution parameters of LED unit
|
Table 2. Image acquisition parameter table

Set citation alerts for the article
Please enter your email address
© Copyright 2018-2021 | Chinese Laser Press. All Rights Reserved 沪ICP备15018463号-20