• Acta Optica Sinica
  • Vol. 43, Issue 23, 2306001 (2023)
Ming Chen1, Jianhua Chang1、2、*, Yao Xu1, Aobo Jin1, and Ziyi Hu1
Author Affiliations
  • 1School of Electronics & Information Engineering, Nanjing University of Information Science & Technology, Nanjing 210044, Jiangsu , China
  • 2Collaborative Innovation Center of Atmospheric Environment and Equipment Technology, Nanjing University of Information Science & Technology, Nanjing 210044, Jiangsu , China
  • show less
    DOI: 10.3788/AOS231145 Cite this Article Set citation alerts
    Ming Chen, Jianhua Chang, Yao Xu, Aobo Jin, Ziyi Hu. Optical Fiber Sensor for Simultaneous Measurement of Temperature, Humidity, and Strain Based on Hollow Core Fiber[J]. Acta Optica Sinica, 2023, 43(23): 2306001 Copy Citation Text show less
    Schematic of sensor structure. (a) Schematic of S-H-S structure; (b) HCF endface diagram
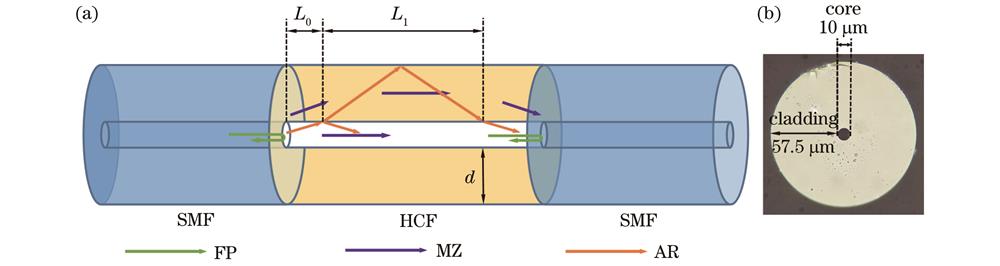
    Fig. 1. Schematic of sensor structure. (a) Schematic of S-H-S structure; (b) HCF endface diagram
    Schematic of optical transmission in FP resonant cavity
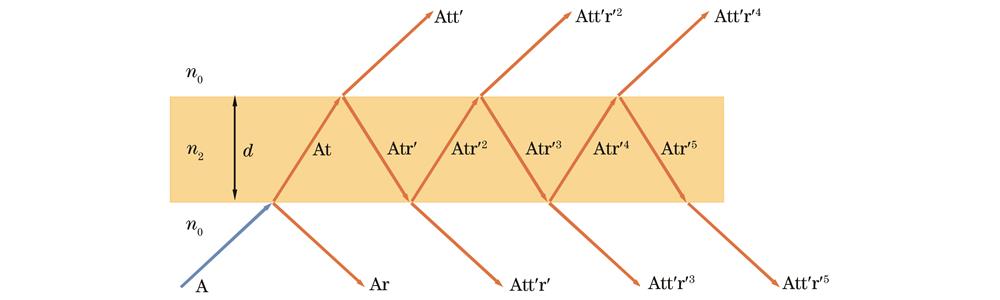
    Fig. 2. Schematic of optical transmission in FP resonant cavity
    Transmission and reflection spectra of the sensor. (a) In the air; (b) in the water
    Fig. 3. Transmission and reflection spectra of the sensor. (a) In the air; (b) in the water
    Microscope diagrams of sensors with different lengths of HCF. (a) 50 μm; (b) 380 μm; (c) 520 μm; (d) 580 μm; (e) 780 μm; (f) 990 μm
    Fig. 4. Microscope diagrams of sensors with different lengths of HCF. (a) 50 μm; (b) 380 μm; (c) 520 μm; (d) 580 μm; (e) 780 μm; (f) 990 μm
    Reflection and transmission spectra for sensors with different lengths of HCF. (a) 50 μm; (b) 380 μm; (c) 520 μm; (d) 580 μm; (e) 780 μm; (f) 990 μm
    Fig. 5. Reflection and transmission spectra for sensors with different lengths of HCF. (a) 50 μm; (b) 380 μm; (c) 520 μm; (d) 580 μm; (e) 780 μm; (f) 990 μm
    Reflection and transmission spectra for sensors with different cladding diameters when HCF length is 520 μm. (a) 125 μm; (b) 100 μm; (c) 90 μm; (d) 80 μm; (e) 65 μm; (f) 50 μm
    Fig. 6. Reflection and transmission spectra for sensors with different cladding diameters when HCF length is 520 μm. (a) 125 μm; (b) 100 μm; (c) 90 μm; (d) 80 μm; (e) 65 μm; (f) 50 μm
    Micrograph of sensor and diagram of experimental setup. (a) Micrograph of sensor; (b) diagram of experimental setup
    Fig. 7. Micrograph of sensor and diagram of experimental setup. (a) Micrograph of sensor; (b) diagram of experimental setup
    Schematic of the position of descending. (a) dip 1; (b) dip 2 and dip 3
    Fig. 8. Schematic of the position of descending. (a) dip 1; (b) dip 2 and dip 3
    Wavelength shift of dip 3 and their linear fitting results changed with relative humidity. (a) Wavelength shift before soak-raise; (b) wavelength shift after soak-raise; (c) linear fitting before soak-raise; (d) linear fitting after soak-raise
    Fig. 9. Wavelength shift of dip 3 and their linear fitting results changed with relative humidity. (a) Wavelength shift before soak-raise; (b) wavelength shift after soak-raise; (c) linear fitting before soak-raise; (d) linear fitting after soak-raise
    Wavelength shift of descending and their linear fitting results changed with the temperature. (a) dip 1; (b) dip 2; (c) dip 3; (d) linear fitting results
    Fig. 10. Wavelength shift of descending and their linear fitting results changed with the temperature. (a) dip 1; (b) dip 2; (c) dip 3; (d) linear fitting results
    Wavelength shift of descending and their linear fitting results changed with relative humidity. (a) dip 1; (b) dip 2; (c) dip 3; (d) linear fitting results
    Fig. 11. Wavelength shift of descending and their linear fitting results changed with relative humidity. (a) dip 1; (b) dip 2; (c) dip 3; (d) linear fitting results
    Wavelength shift of descending and their linear fitting results changed with the strain. (a) dip 1; (b) dip 2; (c) dip 3; (d) linear fitting results
    Fig. 12. Wavelength shift of descending and their linear fitting results changed with the strain. (a) dip 1; (b) dip 2; (c) dip 3; (d) linear fitting results
    Ref.Sensing principleTemperature sensitivity /(pm·℃-1Humidity sensitivity /(pm·%-1Strain sensitivity (pm·με-1
    15Cascade FP cavity and MZI20.414. 64. 8
    17Cascade FP and FBG14.92-3.42
    28Cascade FBG and MFBG9.7217.629-
    29Cascade FPI and FBG12348-
    This workS-H-S22.437.51.22
    Table 1. Comparison of multi-parameter sensors of the same type
    Ming Chen, Jianhua Chang, Yao Xu, Aobo Jin, Ziyi Hu. Optical Fiber Sensor for Simultaneous Measurement of Temperature, Humidity, and Strain Based on Hollow Core Fiber[J]. Acta Optica Sinica, 2023, 43(23): 2306001
    Download Citation