• Chinese Optics Letters
  • Vol. 18, Issue 7, 071101 (2020)
Zijie Li1, Qing Zhao1、*, and Wenlin Gong2、**
Author Affiliations
  • 1Center for Quantum Technology Research, School of Physics, Beijing Institute of Technology, Beijing 100081, China
  • 2Key Laboratory for Quantum Optics and Center for Cold Atom Physics of CAS, Shanghai Institute of Optics and Fine Mechanics, Chinese Academy of Sciences, Shanghai 201800, China
  • show less
    DOI: 10.3788/COL202018.071101 Cite this Article Set citation alerts
    Zijie Li, Qing Zhao, Wenlin Gong. Performance comparison of ghost imaging versus conventional imaging in photon shot noise cases[J]. Chinese Optics Letters, 2020, 18(7): 071101 Copy Citation Text show less
    Typical schematics of (a) computational GI and (b) CI via laser illumination.
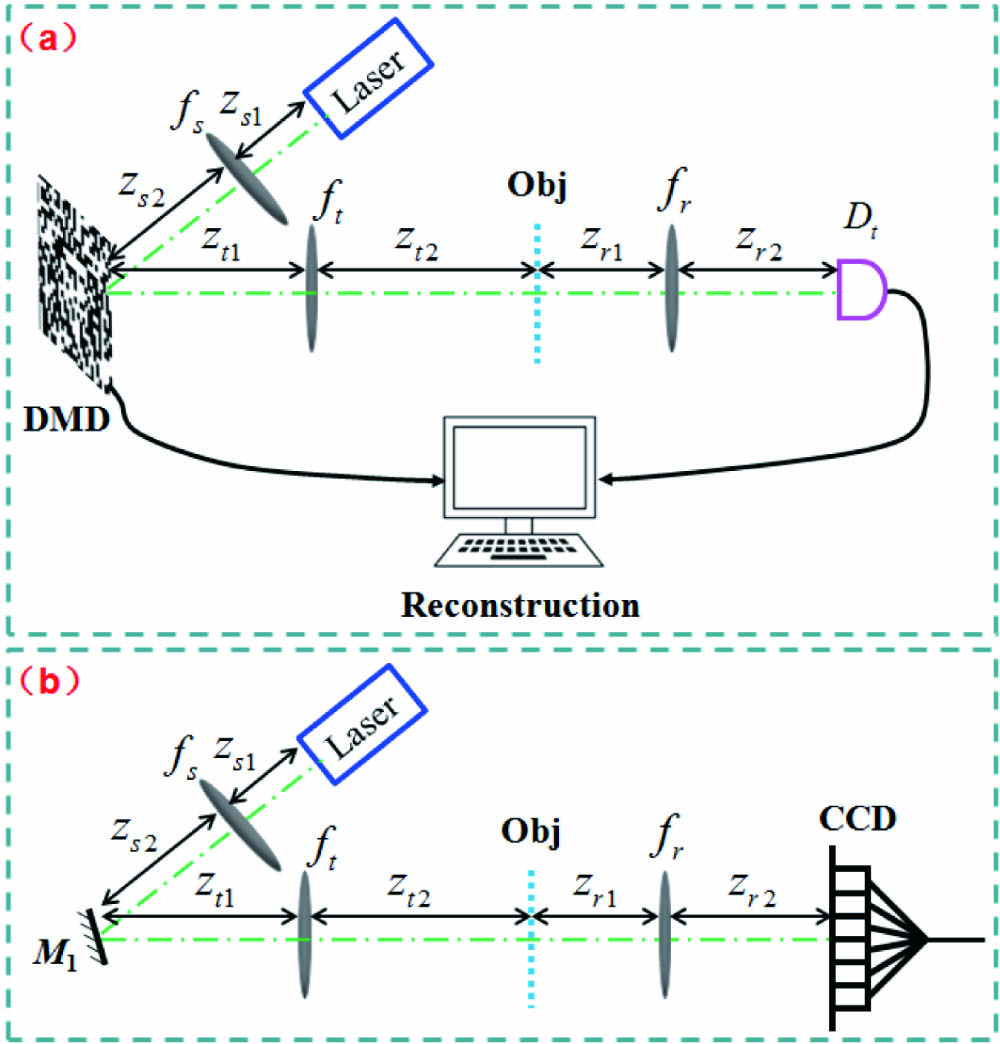
    Fig. 1. Typical schematics of (a) computational GI and (b) CI via laser illumination.
    Simulated results of CI and GI at different I0 when the object’s transmission area Ao=20×20 pixels2 is fixed. (a) The relationship between the DSNR of CI/GI and the number density of photons illuminating the DMD or the reflection mirror I0 (I0=2Io); (b) the dependence of the SNRtran of CI/GI on I0; (c)–(f) the imaging results of CI and GI when I0=1, 3, 10, and 30 photons/pixels2, respectively. The areas shown by the pink dashed box in (c)–(f) correspond to the object’s transmission region achieved by CI and GI.
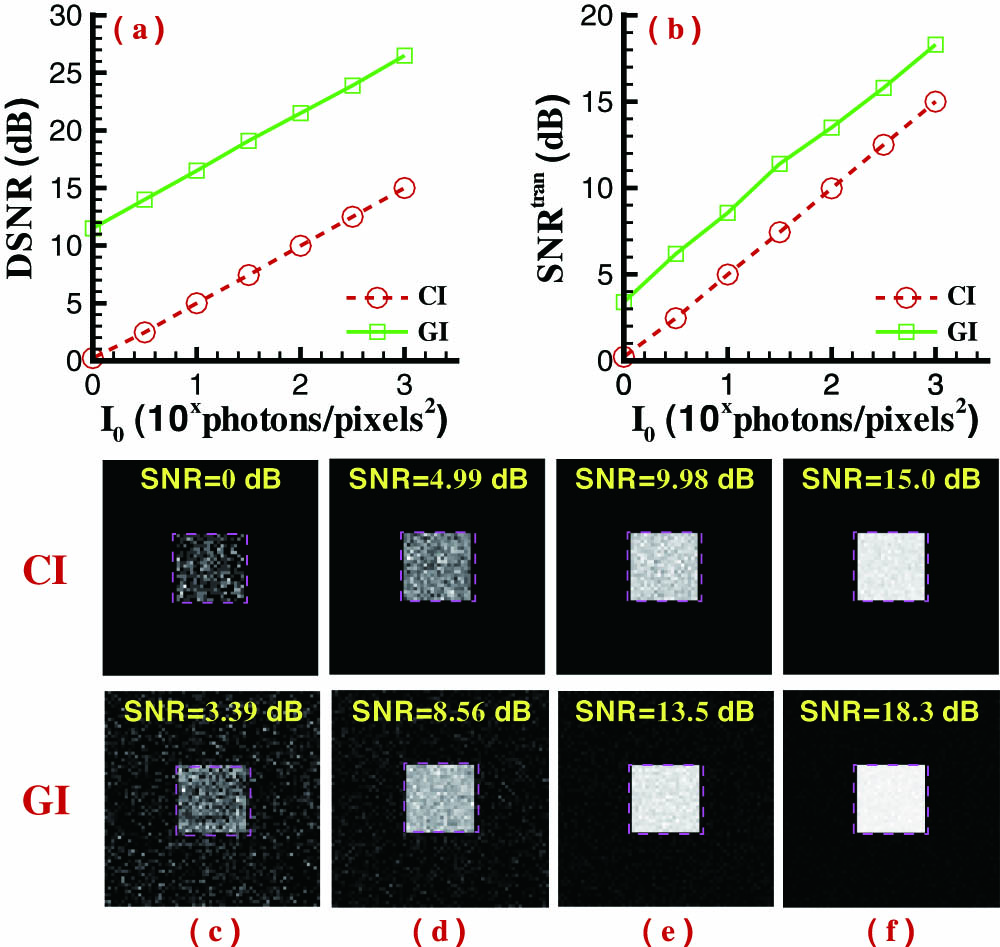
    Fig. 2. Simulated results of CI and GI at different I0 when the object’s transmission area Ao=20×20pixels2 is fixed. (a) The relationship between the DSNR of CI/GI and the number density of photons illuminating the DMD or the reflection mirror I0 (I0=2Io); (b) the dependence of the SNRtran of CI/GI on I0; (c)–(f) the imaging results of CI and GI when I0=1, 3, 10, and 30photons/pixels2, respectively. The areas shown by the pink dashed box in (c)–(f) correspond to the object’s transmission region achieved by CI and GI.
    Simulated results of CI and GI at different Ao in the case of I0=40 photons/pixels2. (a) The relationship between the DSNR of CI/GI and the object’s transmission area Ao; (b) the dependence of the SNRtran of CI/GI on Ao; (c)–(f) the imaging results of CI and GI when Ao=100, 400, 1600, and 3600 pixels2, respectively. The areas labeled by the pink dashed box in (c)–(f) correspond to the object’s transmission region achieved by CI and GI.
    Fig. 3. Simulated results of CI and GI at different Ao in the case of I0=40photons/pixels2. (a) The relationship between the DSNR of CI/GI and the object’s transmission area Ao; (b) the dependence of the SNRtran of CI/GI on Ao; (c)–(f)  the imaging results of CI and GI when Ao=100, 400, 1600, and 3600pixels2, respectively. The areas labeled by the pink dashed box in (c)–(f) correspond to the object’s transmission region achieved by CI and GI.
    Performance comparison of SNRtran for CI and GI for different I0 and Ao.
    Fig. 4. Performance comparison of SNRtran for CI and GI for different I0 and Ao.
    The dependence of CI and GI on SNRtran for different I0 when the threshold value Aothreshold is chosen as 2000 pixels2. (a) The projection diagram of SNRtran based on Fig. 4; (b) the curves of SNRtran−I0 for CI and GI corresponding to the pink dash-dotted line of (a); (c)–(g) the imaging results of CI and GI when I0=10, 100, 200, 280, and 360 photons/pixels2, respectively. The areas labeled by the pink dashed box in (c)–(g) correspond to the object’s transmission region achieved by CI and GI.
    Fig. 5. The dependence of CI and GI on SNRtran for different I0 when the threshold value Aothreshold is chosen as 2000pixels2. (a) The projection diagram of SNRtran based on Fig. 4; (b) the curves of SNRtranI0 for CI and GI corresponding to the pink dash-dotted line of (a); (c)–(g) the imaging results of CI and GI when I0=10, 100, 200, 280, and 360photons/pixels2, respectively. The areas labeled by the pink dashed box in (c)–(g) correspond to the object’s transmission region achieved by CI and GI.
    Performance comparison of SNRtran for CI and GI for different I0 and Ao, which correspond to the diagonal value of SNRtran in Fig. 4. (a) The projection diagram of SNRtran based on Fig. 4; (b) the SNRtran of CI and GI in the case of AoI0=10, corresponding to the pink dash-dotted line of (a); (c)–(g) the imaging results of CI and GI when I0=10 photons/pixels2 and Ao=10×10 pixels2, I0=40 photons/pixels2 and Ao=20×20 pixels2, I0=90 photons/pixels2 and Ao=30×30 pixels2, I0=200 photons/pixels2 and Ao=40×50 pixels2, and I0=360 photons/pixels2 and Ao=60×60 pixels2, respectively. The areas labeled by the pink dashed box in (c)–(g) correspond to the object’s transmission region achieved by CI and GI.
    Fig. 6. Performance comparison of SNRtran for CI and GI for different I0 and Ao, which correspond to the diagonal value of SNRtran in Fig. 4. (a) The projection diagram of SNRtran based on Fig. 4; (b) the SNRtran of CI and GI in the case of AoI0=10, corresponding to the pink dash-dotted line of (a); (c)–(g) the imaging results of CI and GI when I0=10photons/pixels2 and Ao=10×10pixels2, I0=40photons/pixels2 and Ao=20×20pixels2, I0=90photons/pixels2 and Ao=30×30pixels2, I0=200photons/pixels2 and Ao=40×50pixels2, and I0=360photons/pixels2 and Ao=60×60pixels2, respectively. The areas labeled by the pink dashed box in (c)–(g) correspond to the object’s transmission region achieved by CI and GI.
    Zijie Li, Qing Zhao, Wenlin Gong. Performance comparison of ghost imaging versus conventional imaging in photon shot noise cases[J]. Chinese Optics Letters, 2020, 18(7): 071101
    Download Citation