Abstract
The performances of ghost imaging and conventional imaging in photon shot noise cases are investigated. We define an imaging signal-to-noise ratio called SNRtran where only the object’s transmission region is used to evaluate the imaging quality and it can be applied to ghost imaging (GI) with any random pattern. Both the values of GI and of conventional imaging in photon shot noise cases are deduced from a simple statistical analysis. The analytical results, which are backed up by numerical simulations, demonstrate that the value is related to the ratio between the object’s transmission area Ao and the number density of photons illuminating the object plane Io, which is similar to the theoretical results based on the first principle of GI with a Gaussian speckle field deduced by B. I. Erkmen and J. H. Shapiro [in Adv. Opt. Photonics 2, 405–450 (2010)]. In addition, we also show that the value will be larger than when Ao is beyond a threshold value.Ghost imaging (GI), as a nonlocal imaging method, can image an unknown object with a single-pixel detector at the object path[1–6]. In the most recent two decades, GI has been receiving increasing interest and lots of achievements have been made, especially in the fields of remote sensing[7–9], X-ray microscopy[10,11], three-dimensional imaging[12,13], and super-resolution imaging[14–16]. The feasibility of GI has also been experimentally demonstrated[7–20] from X-rays to microwave sources. However, there is still a long way to go for the practical application of GI, because some issues like imaging speed and moving target imaging without the prior knowledge of motion feature have not been solved and some physical mechanisms have not been clarified up to now. For example, for conventional imaging (CI), the imaging signal-to-noise ratio (SNR) is the same as the detection SNR. However, when the intensity of light illuminating the object plane is the same, the detection SNR of GI increases with the object’s transmission area because all the photons transmitted from the object illuminate the same single-pixel detector, but the imaging SNR of GI is reduced and is also related to the property of random coded patterns illuminating the object[5,21–23], which is entirely different from CI. It is natural to ask what the quantitative relationship between the detection SNR and the imaging SNR of GI is. Although Erkmen and Shapiro have done some theoretical analysis on factors affecting the imaging SNR of GI, it was only applied to the random coded patterns with the Gaussian statistical property and the computation of the imaging SNR is relative complicated[22]. Can we propose a new imaging SNR for GI that is used for any random patterns with different statistical properties and is easy to compute? For another example, the photon shot noise, which is the main factor affecting the imaging SNR of CI, will cause the detection signal’s intensity fluctuation, and thus it also affects the imaging SNR of GI due to the object’s information extraction that originates from the intensity fluctuation correlation of light fields for GI. It is natural to ask what conditions should be satisfied if GI is better than CI in photon shot noise cases. In this Letter, we propose an imaging SNR called to evaluate the imaging quality of both GI and CI. Based on the deduced , the influences of some parameters like the photon shot noise, the object’s transmission area, and the number density of photons illuminating the object plane on the imaging quality of GI are clarified, and the performance differences between CI and GI are also discussed by theoretical analysis and numerical simulations.
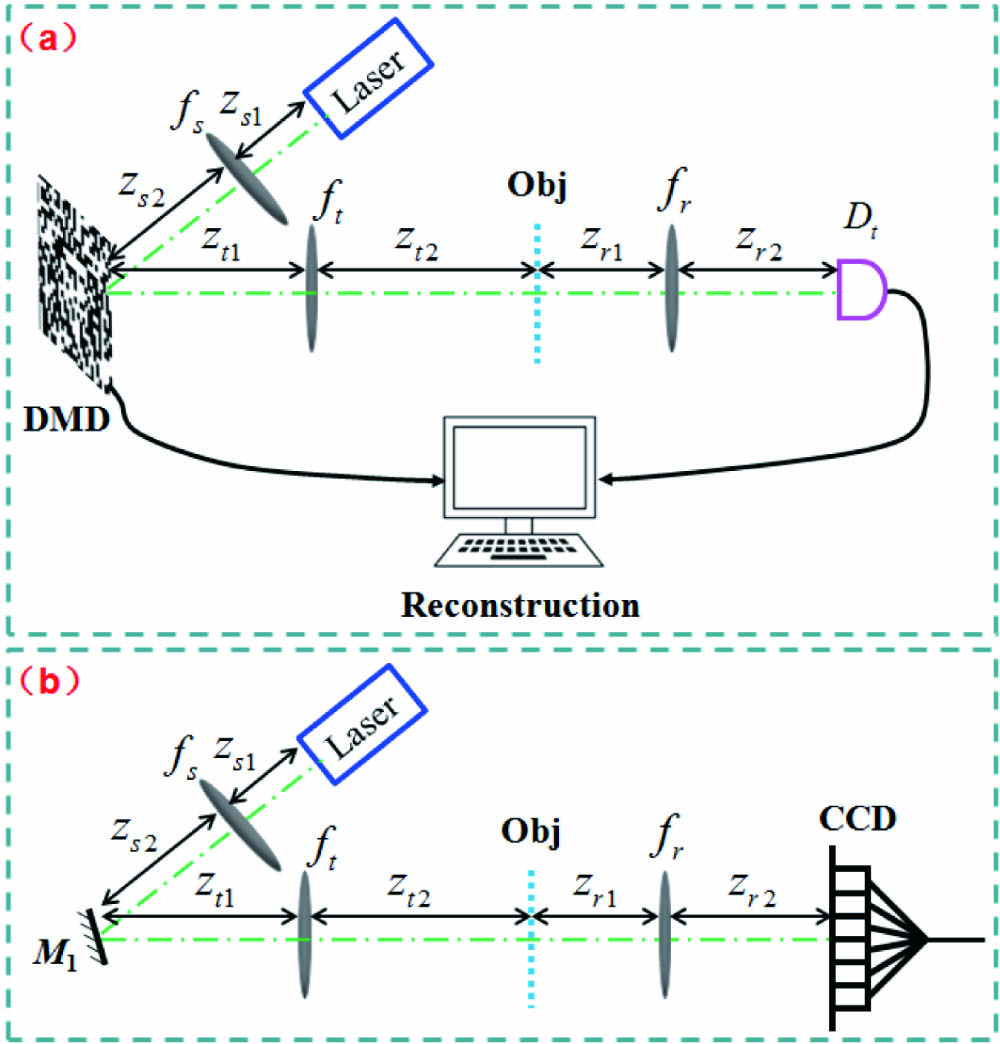
Figure 1(a) presents a typical schematic of computational GI. The light emitted from a pulsed laser uniformly illuminates a digital micro-mirror device (DMD) and a series of random coded patterns are prebuilt by modulating the mirrors of the DMD. Then the patterns reflected by the DMD are imaged onto an object by an optical imaging system with the focal length , and the photons transmitted through the object are imaged onto a bucket detector by using another conventional imaging system with the focal length . In comparison with Fig. 1(a), a conventional imaging setup is shown in Fig. 1(b), where the DMD and the bucket detector are replaced by a reflection mirror and a CCD camera, respectively.

Figure 1.Typical schematics of (a) computational GI and (b) CI via laser illumination.
In the framework of computational GI, the object’s image can be reconstructed by computing the intensity correlation between the pattern’s intensity modulated by the DMD and the total intensity recorded by the bucket detector [6], where denotes the measurement and is the total measurement number. In addition, represents the ensemble average of , and is the intensity fluctuation of .
Sign up for Chinese Optics Letters TOC. Get the latest issue of Chinese Optics Letters delivered right to you!Sign up now
When the numerical aperture of the lens with a focal length shown in Fig. 1(a) is large enough, and considering the photon shot noise of the detection system, the total intensity can be expressed as where and is the object’s transmission function. In addition, and represents the Poisson distribution with the mean value .
For the setup of GI displayed in Fig. 1(a), the bucket detector collects all the photons transmitted through the object. If only considering the photon shot noise of the detection system, the detection signal-to-noise ratio (DSNR) of GI can be represented as where is the average number density of photons illuminating the object plane, the quantum efficiency of the detector is assumed to be 1, and is the transmission area of the object. In addition, and denotes the standard deviation of the noise vector . From Eq. (3), it is obviously observed that the value of GI depends on the number density of photons illuminating the object plane and the object’s transmission area .
When the measurement number is large enough or the patterns conform to an orthogonal statistical distribution [namely the inner product of any two speckles is zero and the mean value of is also zero], Eq. (1) can be simplified as where denotes the coherence function of the two signals and denotes the convolution symbol. is approximately a noise vector with the mean value 0 and the standard deviation value 1, and . From Eq. (4), it is clearly seen that the first term of Eq. (4) corresponds to the object’s image and the spatial resolution of GI is determined by the function . The second term of Eq. (4) represents a random noise image, which will cause a degradation of GI quality. In addition, because the amplitude of the noise image is , the imaging SNR of GI will decrease as the object’s transmission area is increased, and increase with the photon number density when only the photon shot noise of the detection system is considered, which is similar to the theoretical results of GI with a Gaussian speckle field[22].
The imaging SNR of the object’s transmission region for GI can be defined as where and are the standard deviation and mean value of the reconstructed object’s transmission region in the spatial domain, respectively.
Conventional imaging is based on the point-to-point information extraction mode, and thus the imaging SNR is also equal to the system’s DSNR. In comparison with GI, for the schematic shown in Fig. 1(b), if only the photon shot noise of the detection system is considered, then the imaging SNR of the object’s transmission region can be expressed as where is the photon number received by the CCD camera at each pixel. In addition, Eq. (6) suggests that both and of CI increase with .
To verify the analytical results, the parameters of the numerical simulation based on the schematic of Fig. 1 are set as follows: the wavelength of the laser is 532 nm and the transverse size of the laser beam illuminating the DMD is 10 mm by a conventional imaging system with the magnification . The modulated area of the DMD is and the speckle’s transverse size is set as . The speckles modulated by the DMD are Hadamard patterns and the measurement number , and thus the average number density of photons illuminating the DMD or the reflecting mirror is for the demonstration of the performance comparison between CI and GI. In addition, , , and the transmission apertures of both the lenses and are 25 mm. For the image reconstruction of GI, we have used the intensity fluctuation correlation reconstruction algorithm[24]. When the object’s transmission area is , Figs. 2(a) and 2(b) illustrate the relationship between the value and for both CI and GI. The imaging results of both CI and GI are shown in Figs. 2(c)–2(f) when the number density of photons illuminating the DMD is , and , respectively. If is fixed at , the DSNR and on the object’s transmission area are shown in Fig. 3. From Figs. 2 and 3, it is obviously observed that for CI the values of both and increase with and do not depend on , whereas the value is proportional to for GI. What is more, the value of increases with but is reduced with the increase of . Such simulation results displayed in Figs. 2 and 3 agree with the theoretical prediction described by Eqs. (3)–(6). In addition, the results shown in Figs. 3(b) and 3(f) also suggest that the imaging quality of CI will be better than that of GI when the object’s transmission area is beyond a threshold value [for example, in Fig. 3(b)].
Figure 2.Simulated results of CI and GI at different when the object’s transmission area is fixed. (a) The relationship between the DSNR of CI/GI and the number density of photons illuminating the DMD or the reflection mirror (); (b) the dependence of the of CI/GI on ; (c)–(f) the imaging results of CI and GI when , 3, 10, and , respectively. The areas shown by the pink dashed box in (c)–(f) correspond to the object’s transmission region achieved by CI and GI.
Figure 3.Simulated results of CI and GI at different in the case of . (a) The relationship between the DSNR of CI/GI and the object’s transmission area ; (b) the dependence of the of CI/GI on ; (c)–(f) the imaging results of CI and GI when , 400, 1600, and , respectively. The areas labeled by the pink dashed box in (c)–(f) correspond to the object’s transmission region achieved by CI and GI.
In order to further clarify the performance differences between CI and GI, Fig. 4 presents and for different and . From Fig. 4, we find that if , the value will be always greater than that of GI and the influence of the photon number density on and is displayed in Fig. 5 when is fixed. It is clearly seen that if , both the imaging quality [see Figs. 5(c)–5(g)] and [see Fig. 5(b)] of CI and GI are equivalent for the same . Furthermore, as shown in Fig. 6, for the diagonal value of of GI [see Figs. 4 and 6(a)], the value of is also the same if maintains a constant value, which can be explained by Eq. (4) and means that imaging an object with a large transmission area needs a much higher compared with imaging an object with a small transmission area [see Eq. (4)]. Therefore, in order to obtain the same for two objects with the transmission areas and , based on Eq. (3) and Eq. (4), the should satisfy . In addition, although we have used Hadamard patterns to illuminate the object for GI, Eq. (4) is universal and the results described above can be applied to GI with any random pattern.
Figure 4.Performance comparison of for CI and GI for different and .
Figure 5.The dependence of CI and GI on for different when the threshold value is chosen as . (a) The projection diagram of based on Fig. 4; (b) the curves of for CI and GI corresponding to the pink dash-dotted line of (a); (c)–(g) the imaging results of CI and GI when , 100, 200, 280, and , respectively. The areas labeled by the pink dashed box in (c)–(g) correspond to the object’s transmission region achieved by CI and GI.
Figure 6.Performance comparison of for CI and GI for different and , which correspond to the diagonal value of in Fig. 4. (a) The projection diagram of based on Fig. 4; (b) the of CI and GI in the case of , corresponding to the pink dash-dotted line of (a); (c)–(g) the imaging results of CI and GI when and , and , and , and , and and , respectively. The areas labeled by the pink dashed box in (c)–(g) correspond to the object’s transmission region achieved by CI and GI.
In conclusion, the defined is valid to evaluate the imaging quality of both GI and CI for a transmission object. Both the analytical and simulated results have shown that for CI the value , which is the same as , increases with and does not depend on , whereas the is proportional to for GI. What is more, the will be enhanced as is increased but reduced with the increase of . In addition, we can obtain the same when maintains a constant value, and will be larger than when is beyond a threshold value. Such results are helpful for the solution selection of GI and CI in practical applications.
References
[1] J. Cheng, S. Han. Phys. Rev. Lett., 92, 093903(2004).
[2] R. S. Bennink, S. J. Bentley, R. W. Boyd, J. C. Howell. Phys. Rev. Lett., 92, 033601(2004).
[3] D. Z. Cao, J. Xiong, K. Wang. Phys. Rev. A, 71, 013801(2005).
[4] M. D. Angelo, Y. H. Shih. Laser Phys. Lett., 2, 567(2005).
[5] A. Gatti, M. Bache, D. Magatti, E. Brambilla, F. Ferri, L. A. Lugiato. J. Mod. Opt., 53, 739(2006).
[6] Y. Bromberg, O. Katz, Y. Silberberg. Phys. Rev. A, 79, 053840(2009).
[7] C. Zhao, W. Gong, M. Chen, E. Li, H. Wang, W. Xu, S. Han. Appl. Phys. Lett., 101, 141123(2012).
[8] C. Wang, X. Mei, L. Pan, P. Wang, W. Li, X. Gao, Z. Bo, M. Chen, W. Gong, S. Han. Remote Sens., 10, 732(2018).
[9] C. Deng, L. Pan, C. Wang, X. Gao, W. Gong, S. Han. Photon. Res., 5, 431(2017).
[10] H. Yu, R. Lu, S. Han, H. Xie, G. Du, T. Xiao, D. Zhu. Phys. Rev. Lett., 117, 113901(2016).
[11] A. Zhang, Y. He, L.-A. Wu, L. Chen, B. Wang. Optica, 5, 374(2018).
[12] W. Gong, C. Zhao, J. Jiao, E. Li, M. Chen, H. Wang, W. Xu, S. Han. Sci. Rep., 6, 26133(2016).
[13] M. Sun, M. P. Edgar, G. M. Gibson, B. Sun, N. Radwell, R. Lamb, M. J. Padgett. Nat. Commun., 7, 12010(2016).
[14] W. Gong, S. Han. Sci. Rep., 5, 9280(2015).
[15] X. Chen, F. Kong, Q. Fu, S. Meng, L-A. Wu. Opt. Lett., 42, 5290(2017).
[16] J. Shi, G. Patera, Y. Gui, M. I. Kolobov, D. B. Horoshko, S. Han. Chin. Opt. Lett., 16, 092701(2018).
[17] H. Guo, R. He, C. Wei, Z. Lin, L. Wang, S. Zhao. Chin. Opt. Lett., 17, 071101(2019).
[18] H. Liu, S. Zhang. Appl. Phys. Lett., 111, 031110(2017).
[19] R. I. Stantchev, B. Sun, S. M. Hornett, P. Hobson, G. M. Gibson, M. J. Padgett, E. Hendry. Sci. Adv., 2, e1600190(2016).
[20] X. Wang, Z. Lin. IEEE Trans. Geosci. Remote Sens., 56, 4747(2018).
[21] F. Ferri, D. Magatti, L. A. Lugiato, A. Gatti. Phys. Rev. Lett., 104, 253603(2010).
[22] B. I. Erkmen, J. H. Shapiro. Adv. Opt. Photonics, 2, 405(2010).
[23] C. Wang, W. Gong, X. Shao, S. Han. J. Opt., 18, 065703(2016).
[24] W. Gong, S. Han. Phys. Lett. A, 374, 1005(2010).