• Laser & Optoelectronics Progress
  • Vol. 59, Issue 13, 1330001 (2022)
Maoning Chen and Lingling Wu*
Author Affiliations
  • School of Optoelectronic Engineering, Xi'an Technological University, Xi'an 710021, Shaanxi , China
  • show less
    DOI: 10.3788/LOP202259.1330001 Cite this Article Set citation alerts
    Maoning Chen, Lingling Wu. Application of Fluorescence Analysis in the Detection of Early Caries[J]. Laser & Optoelectronics Progress, 2022, 59(13): 1330001 Copy Citation Text show less
    Samples of teeth with different degrees of caries. (a) Healthy teeth; (b) shallow caries; (c) moderate caries; (d) deep caries
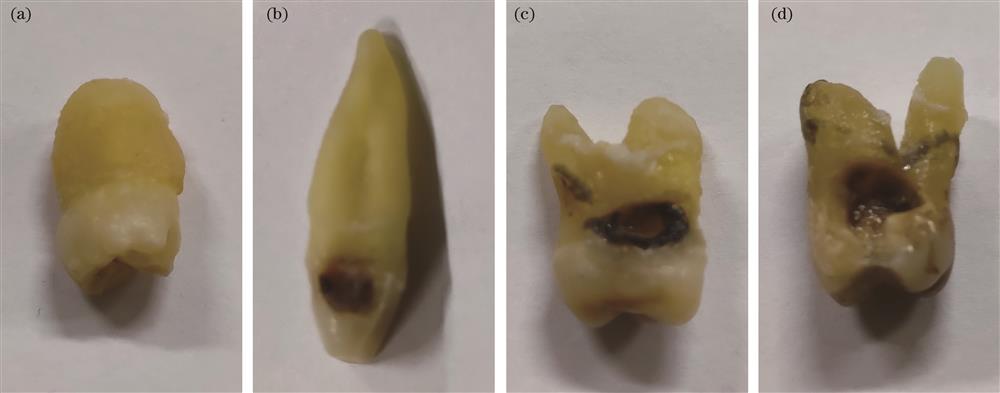
    Fig. 1. Samples of teeth with different degrees of caries. (a) Healthy teeth; (b) shallow caries; (c) moderate caries; (d) deep caries
    Schematic diagram of fluorescence test system
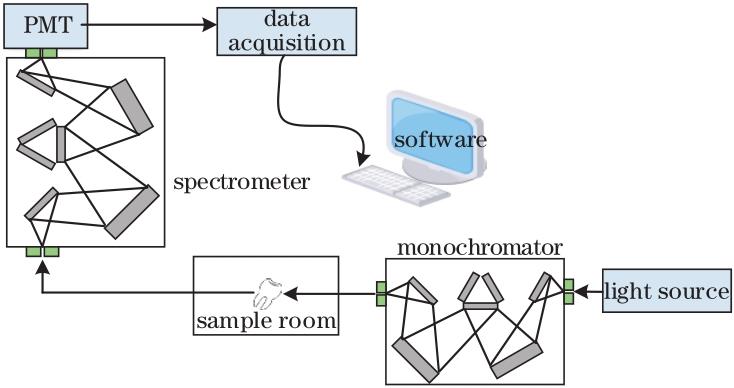
    Fig. 2. Schematic diagram of fluorescence test system
    Real object diagram of fluorescence spectrum test system
    Fig. 3. Real object diagram of fluorescence spectrum test system
    Comparison of original spectral distribution and spectral distribution after treatment
    Fig. 4. Comparison of original spectral distribution and spectral distribution after treatment
    Excitation spectra of samples at different fluorescence wavelengths. (a) 480 nm; (b) 623 nm and 685 nm; (c) 625 nm and 685 nm; (d) 623 nm and 690 nm
    Fig. 5. Excitation spectra of samples at different fluorescence wavelengths. (a) 480 nm; (b) 623 nm and 685 nm; (c) 625 nm and 685 nm; (d) 623 nm and 690 nm
    Fluorescence spectra of teeth with different degrees of caries. (a) Healthy teeth; (b) shallow caries; (c) moderate caries; (d) deep caries
    Fig. 6. Fluorescence spectra of teeth with different degrees of caries. (a) Healthy teeth; (b) shallow caries; (c) moderate caries; (d) deep caries
    Schematic diagram of system structure
    Fig. 7. Schematic diagram of system structure
    Physical image of fluorescence image acquisition system
    Fig. 8. Physical image of fluorescence image acquisition system
    Fluorescence images of teeth with different degrees of caries. (a) Healthy teeth; (b) shallow caries; (c) moderate caries; (d) deep caries
    Fig. 9. Fluorescence images of teeth with different degrees of caries. (a) Healthy teeth; (b) shallow caries; (c) moderate caries; (d) deep caries
    Fluorescence images of human teeth
    Fig. 10. Fluorescence images of human teeth
    ICDAS codeCriteria for visual lesion detectionDegree of severity of lesion
    0Sound surface
    1Earliest optical change,visible on drying enamelDemineralisation in outer third of enamel
    2Clear enamel change;while or brown blemishes,visible without dryingDemineralisation reaching the inner third of enamel,possibly the ADJ
    3Localised break in enamelDemineralisation of outer third of dentine
    4Dentine not visibleDemineralisation of middle third of dentine,no weakening of dental crown structure
    5Enamel opaque or grayish,suggestive of and underlying dentine lesion,with or without enamel cavitationsDemineralisation of middle third of dentine,weakening of dental crown structure
    6Dentine cavityDemineralisation of inner third of dentine,undermining of casp structure and support
    Table 1. ICDAD grading criteria
    Fluorescent geneAbsorption wavelength /nmFluorescence wavelength /nm
    Collagen300‒340430‒485
    Hydroxyapatite405465,523
    Coproporphyrin403,531,565623,624,687
    Protoprophyrin406,505,575623,625,685,690
    Table 2. Fluorescent gene effect of tooth tissue
    SpecimenFluorescence wavelength /nm
    Healthy teeth480,509
    Shallow caries480,515,624,684
    Moderate caries498,623,687
    Deep caries500,625,689
    Table 3. Fluorescence peak values of different degrees of caries
    Maoning Chen, Lingling Wu. Application of Fluorescence Analysis in the Detection of Early Caries[J]. Laser & Optoelectronics Progress, 2022, 59(13): 1330001
    Download Citation