• Acta Optica Sinica
  • Vol. 41, Issue 6, 0601002 (2021)
Guifen Wang1、2、*, Yinxue Zhang1、2, Wenlong Xu1、2, Wen Zhou3, Hualian Wu4, Zhantang Xu3, and Wenxi Cao3
Author Affiliations
  • 1Key Laboratory of Marine Hazards Forecasting, Ministry of Natural Resources, Hohai University, Nanjing, Jiangsu 210098, China
  • 2College of Oceanography, Hohai University, Nanjing, Jiangsu 210098, China
  • 3State Key Laboratory of Tropical Oceanography, South China Sea Institute of Oceanology, Chinese Academy of Sciences, Guangzhou, Guangdong 510301, China
  • 4CAS Key Laboratory of Tropical Marine Bio-Resources and Ecology, South China Sea Institute of Oceanology, Chinese Academy of Sciences, Guangzhou, Guangdong 510301, China
  • show less
    DOI: 10.3788/AOS202141.0601002 Cite this Article Set citation alerts
    Guifen Wang, Yinxue Zhang, Wenlong Xu, Wen Zhou, Hualian Wu, Zhantang Xu, Wenxi Cao. Estimation of Phytoplankton Pigment Concentration in the South China Sea from Hyperspectral Absorption Data[J]. Acta Optica Sinica, 2021, 41(6): 0601002 Copy Citation Text show less
    Regression relationship between concentration of TChl a and concentration of accessory pigments (AP)
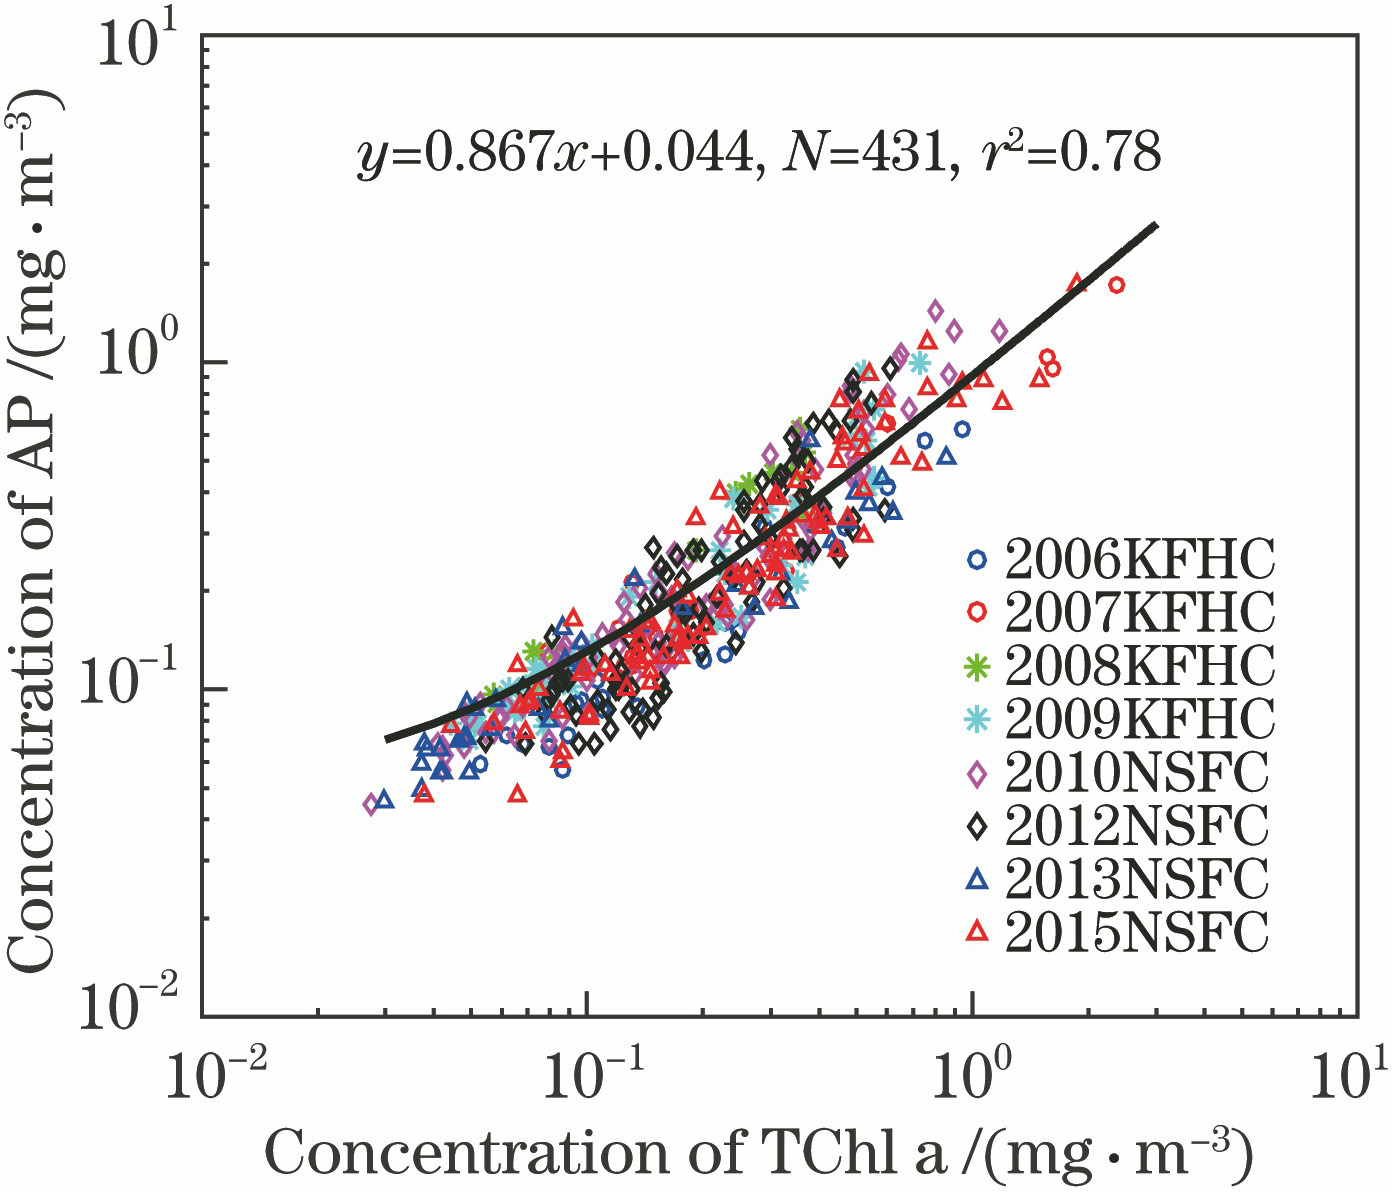
    Fig. 1. Regression relationship between concentration of TChl a and concentration of accessory pigments (AP)
    Representative spectral absorption coefficients and their derivatives. (a) 4th derivative spectrum; (b) 2nd derivative spectrum; (c)1st derivative spectrum; (d) absorption coefficient
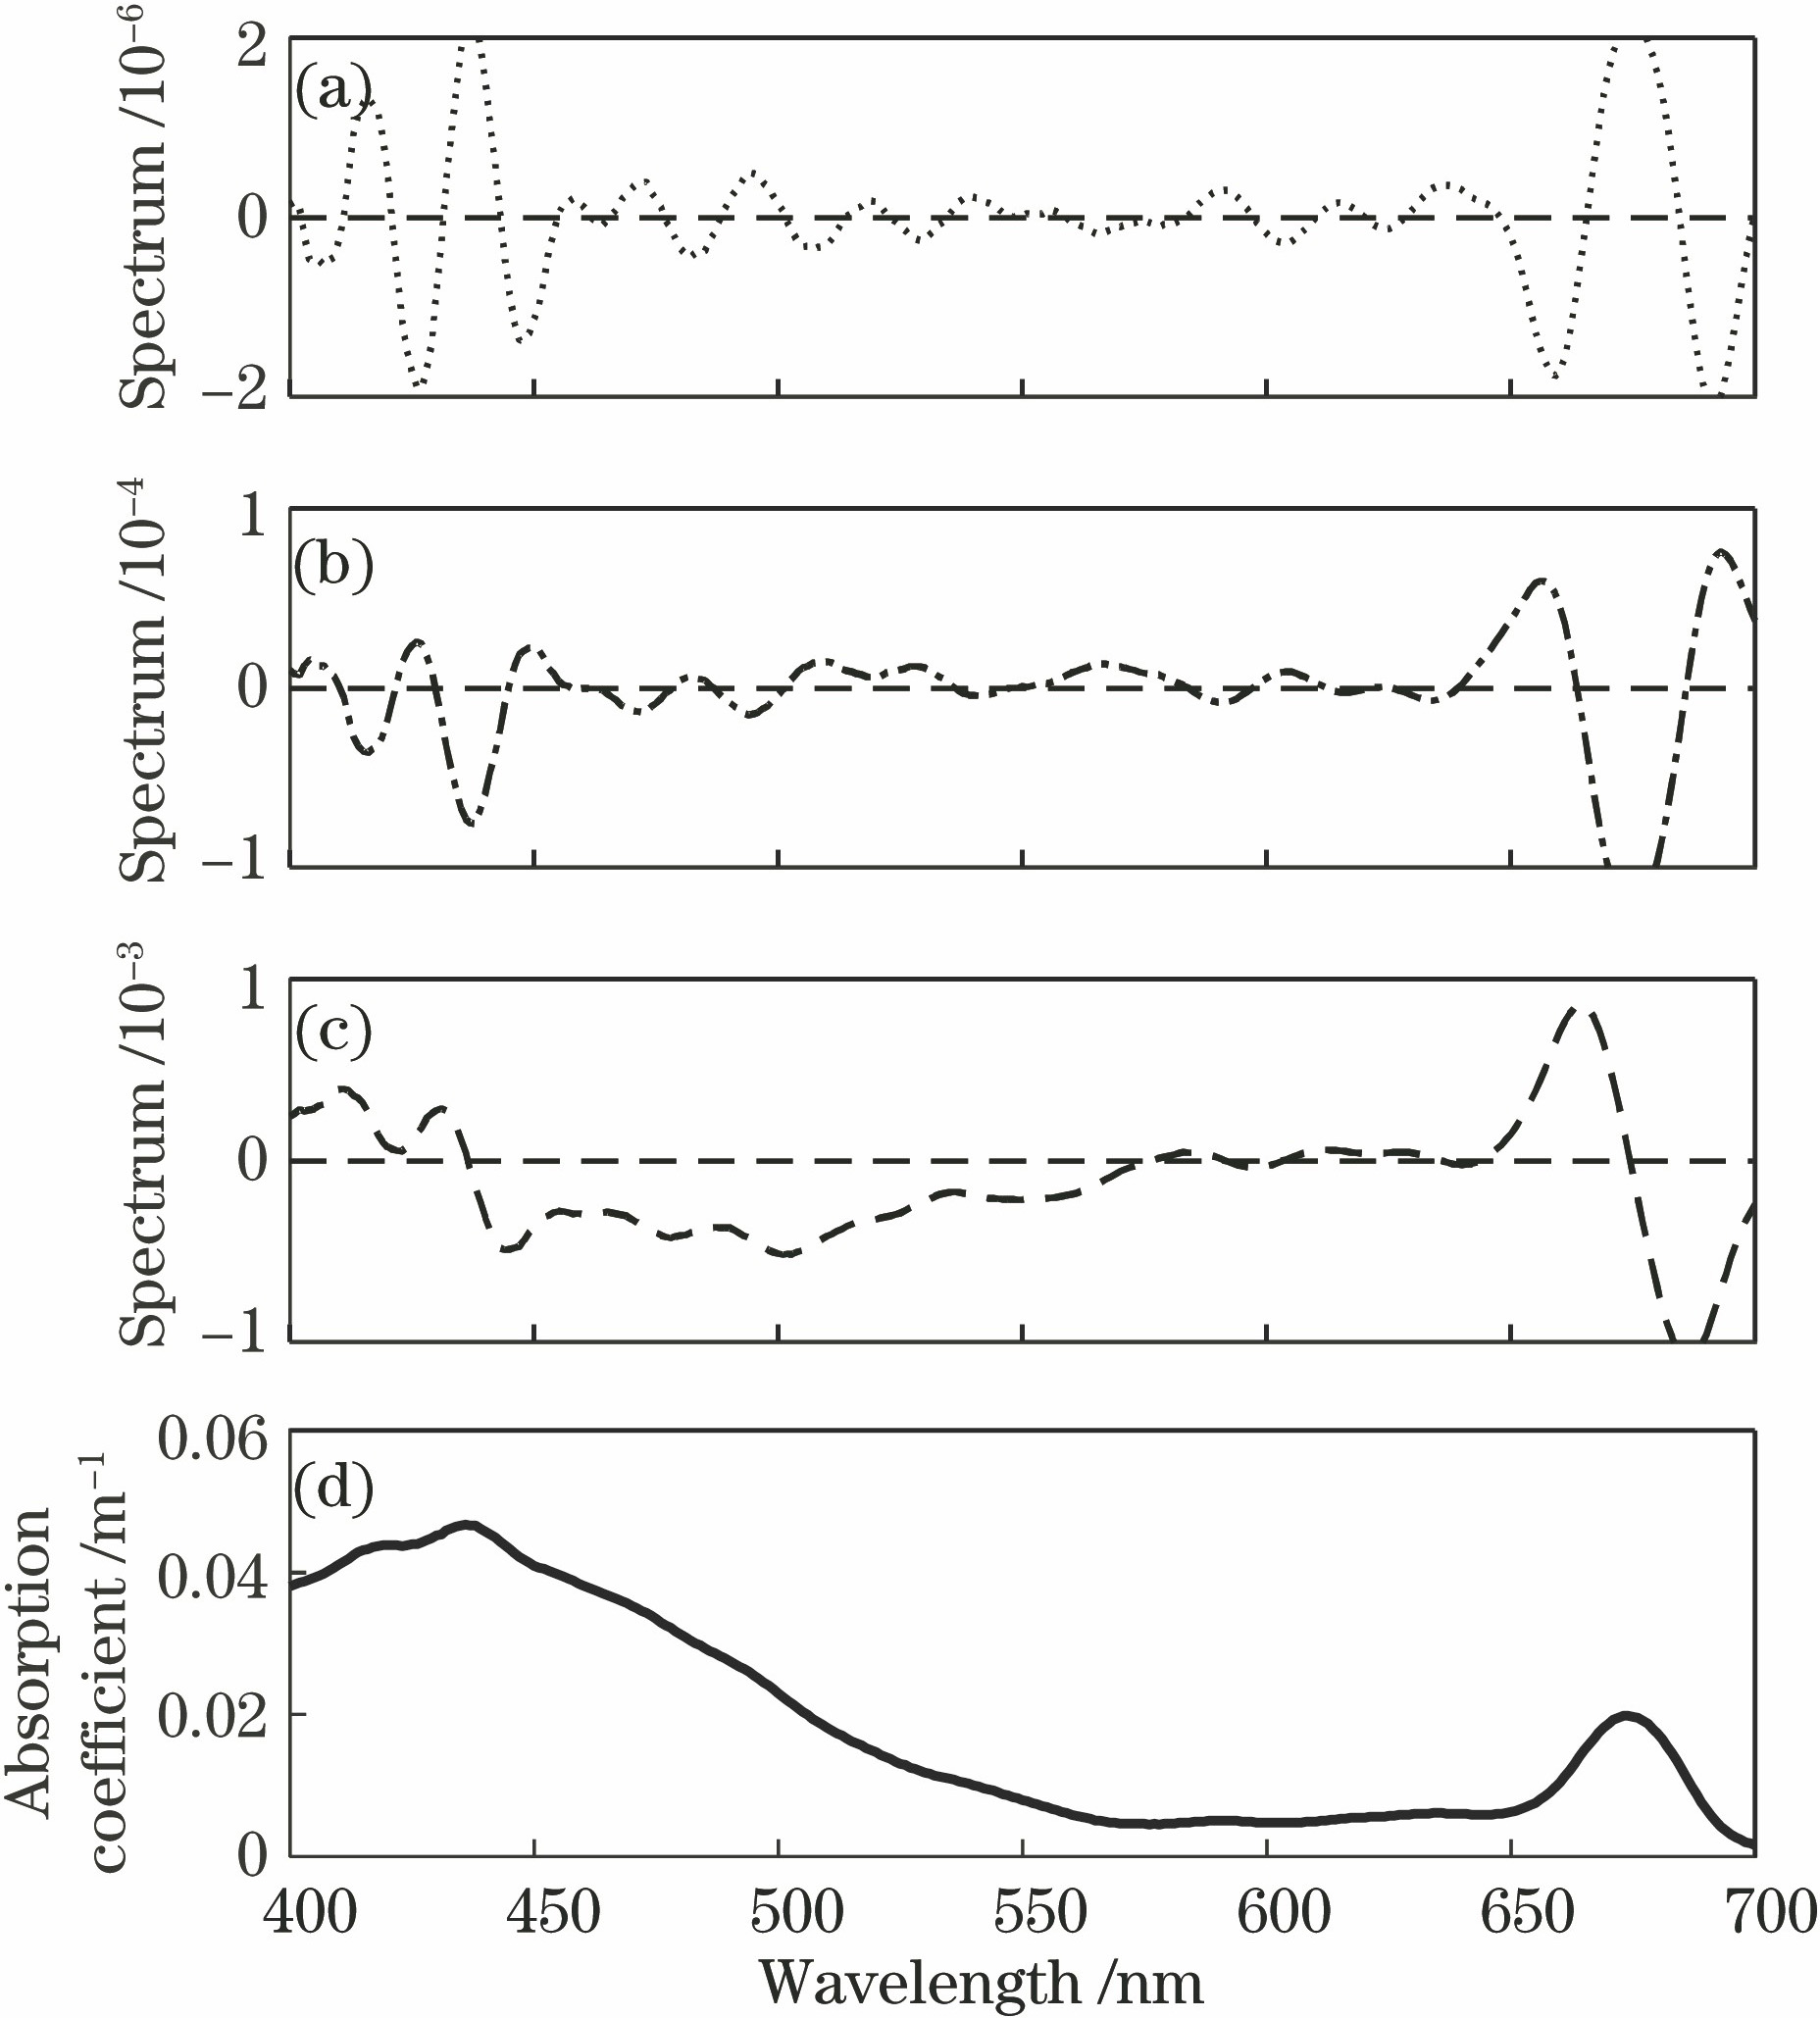
    Fig. 2. Representative spectral absorption coefficients and their derivatives. (a) 4th derivative spectrum; (b) 2nd derivative spectrum; (c)1st derivative spectrum; (d) absorption coefficient
    Correlation coefficients between selected phytoplankton pigments concentration and derivative spectra. (a)(b) 1st derivative spectra; (c)(d) 2nd derivative spectra; (e)(f) 4th derivative spectra
    Fig. 3. Correlation coefficients between selected phytoplankton pigments concentration and derivative spectra. (a)(b) 1st derivative spectra; (c)(d) 2nd derivative spectra; (e)(f) 4th derivative spectra
    Comparison between the predicted value from the PLS model based on 2nd derivative spectrum and the measured pigment concentrations for the validation data set, in which the 1∶1 ratio is shown as a solid line. (a) TChl a; (b) PSC; (c) PPC; (d) 19But; (e) Fuco; (f) 19Hex; (g) Diadino; (h) Zea
    Fig. 4. Comparison between the predicted value from the PLS model based on 2nd derivative spectrum and the measured pigment concentrations for the validation data set, in which the 1∶1 ratio is shown as a solid line. (a) TChl a; (b) PSC; (c) PPC; (d) 19But; (e) Fuco; (f) 19Hex; (g) Diadino; (h) Zea
    Comparison between the predicted value from the PLS model based on 4th derivative spectrum and the measured pigment concentrations for the validation data set, in which the 1∶1 ratio is shown as a solid line. (a) TChl a; (b) PSC; (c) PPC; (d) 19But; (e) Fuco; (f) 19Hex; (g) Diadino; (h) Zea
    Fig. 5. Comparison between the predicted value from the PLS model based on 4th derivative spectrum and the measured pigment concentrations for the validation data set, in which the 1∶1 ratio is shown as a solid line. (a) TChl a; (b) PSC; (c) PPC; (d) 19But; (e) Fuco; (f) 19Hex; (g) Diadino; (h) Zea
    Comparison of the validation results between the PLS regression model based on the 2nd and 4th derivative spectra and the empirical model based on total TChl a concentration. (a) Determination coefficient R2 for linear regression between the predicted and measured pigment concentrations; (b) RMSE; (c) median percent difference; (d) mean percent difference
    Fig. 6. Comparison of the validation results between the PLS regression model based on the 2nd and 4th derivative spectra and the empirical model based on total TChl a concentration. (a) Determination coefficient R2 for linear regression between the predicted and measured pigment concentrations; (b) RMSE; (c) median percent difference; (d) mean percent difference
    Validation results of the PLS regression model based on the 2nd derivative spectrum and data collected in different months. (a) Determination coefficient R2 for linear regression between the predicted and measured pigment concentrations; (b) RMSE; (c) median percent difference; (d) mean percent difference
    Fig. 7. Validation results of the PLS regression model based on the 2nd derivative spectrum and data collected in different months. (a) Determination coefficient R2 for linear regression between the predicted and measured pigment concentrations; (b) RMSE; (c) median percent difference; (d) mean percent difference
    CruisePeriodNumber of samples
    200609 KFHC2006.0924
    200708 KFHC2007.0827
    200808 KFHC2008.0814
    200909 KFHC2009.0948
    201004 NSFC2010.0489
    201212 NSFC2012.1297
    201308 NSFC2013.0837
    201506 NSFC2015.0695
    Table 1. Cruise information in the South China Sea between 2006—2015
    Pigment nameAbbreviation
    Chlorophyll aChl a
    Chlorophyll bChl b
    Chlorophyll c1,c2Chl c1+2
    Chlorophyll c3Chl c3
    Divinyl Chlorophyll aDV Chla
    FucoxanthinFuco
    PeridininPerid
    19'-hexanoyloxyfucoxanthin19Hex
    ZeaxanthinZea
    19'-butanoyloxyfucoxanthin19But
    AlloxanthinAllo
    DiadinoxanthinDiadino
    β-caroteneβ caro
    Table 2. Used pigments and their abbreviations
    PigmentRangeMeanStandard deviationCorrelation coefficient R
    TChl a[0.027,2.317]0.2620.2611.00
    PSC[0.007,1.029]0.0870.1150.87
    PPC[0.011,0.442]0.0910.0470.58
    19But[0.001,0.205]0.0200.0290.78
    Fuco[0.001,0.888]0.0270.0720.78
    19Hex[0.004,0.209]0.0350.0360.84
    Diadino[0.001,0.070]0.0070.0080.72
    Zea[0.001,0.355]0.0620.0340.03
    Table 3. Statistical distribution of different pigments, and the correlation coefficients R of log-transformed concentrations between accessory pigments and total Chlorophyll a (N=431)
    PLS modelPigmentNRMSE /(mg·m-3)ηx/%ηy/%R2ab
    Based on 2ndderivative spectrumTChl a70.12987.9279.270.720.7610.060
    PSC40.05482.6979.110.740.7480.019
    PPC40.03482.2347.330.380.4130.052
    19But30.01780.1566.520.630.6460.006
    Fuco50.03584.6283.760.720.7250.006
    19Hex30.02379.4963.270.570.6170.013
    Diadino80.00489.8680.580.720.7450.002
    Zea40.02782.2239.180.280.3150.044
    Based on 4thderivative spectrumTChl a60.13975.2775.940.680.7160.071
    PSC50.05772.3677.620.700.7180.022
    PPC120.03689.4252.550.300.3920.054
    19But50.01873.8866.350.590.6260.006
    Fuco50.04069.8578.200.640.6470.008
    19Hex20.02258.2261.500.580.6040.013
    Diadino60.00475.0476.450.670.7110.002
    Zea120.02889.4443.450.200.2740.046
    Table 4. PLS parameters of 2nd derivative spectrum and 4th derivative spectrum models
    PLS modelPigmentR2abRMSE /(mg·m-3)NΔMDPD /%ΔMPD /%
    PLS model based on 2ndderivative spectrumTChl a0.750.6150.0740.169024.9937.83
    PSC0.970.7140.0110.049025.8336.00
    PPC0.540.2960.0560.045021.8531.41
    19But0.830.7040.0070.014030.9562.03
    Fuco0.880.5580.0060.0453175.01118.31
    19Hex0.820.6990.0120.017027.0342.87
    Diadino0.730.5430.0020.006130.7237.83
    Zea0.590.2830.0400.033028.69114.26
    PLS model based on 4thderivative spectrumTChl a0.720.5630.0890.180127.2943.65
    PSC0.890.6360.0200.063333.2251.14
    PPC0.380.2890.0560.048023.7937.18
    19But0.800.6880.0070.015132.1370.45
    Fuco0.670.4150.0100.0603380.94153.48
    19Hex0.830.6690.0090.018121.6533.50
    Diadino0.710.4610.0030.006024.0835.88
    Zea0.430.2900.0380.034235.64103.47
    Table 5. Validation results for the PLS model based on the 2nd and 4th derivative spectra
    PigmentABR2abRMSE /(mg·m-3)ΔMDPD /%ΔMPD /%
    PSC0.3721.1440.830.8080.0130.05734.9141.82
    PPC0.1490.3100.280.2360.0750.04920.6242.17
    19But0.0630.8050.440.3660.0130.02563.85118.41
    Fuco0.1721.9120.590.6560.0090.05848.2563.89
    19Hex0.0990.7010.750.5830.0160.02133.3556.19
    Diadino0.0260.9770.840.7420.0020.00424.1728.44
    Zea0.0790.1280.000.0090.0660.04426.78212.20
    Table 6. Empirical model's coefficients(A,B) based on TChl a and the validation results
    Guifen Wang, Yinxue Zhang, Wenlong Xu, Wen Zhou, Hualian Wu, Zhantang Xu, Wenxi Cao. Estimation of Phytoplankton Pigment Concentration in the South China Sea from Hyperspectral Absorption Data[J]. Acta Optica Sinica, 2021, 41(6): 0601002
    Download Citation