
Jianwei ZHENG, Xinjie ZHOU, Honghui XU, Mengjie QING, Cong BAI. Hyperspectral Image Super Resolution via Nonconvex Low-rank Constraint of Tensor Ring Factors[J]. Acta Photonica Sinica, 2022, 51(2): 0210003
- Acta Photonica Sinica
- Vol. 51, Issue 2, 0210003 (2022)
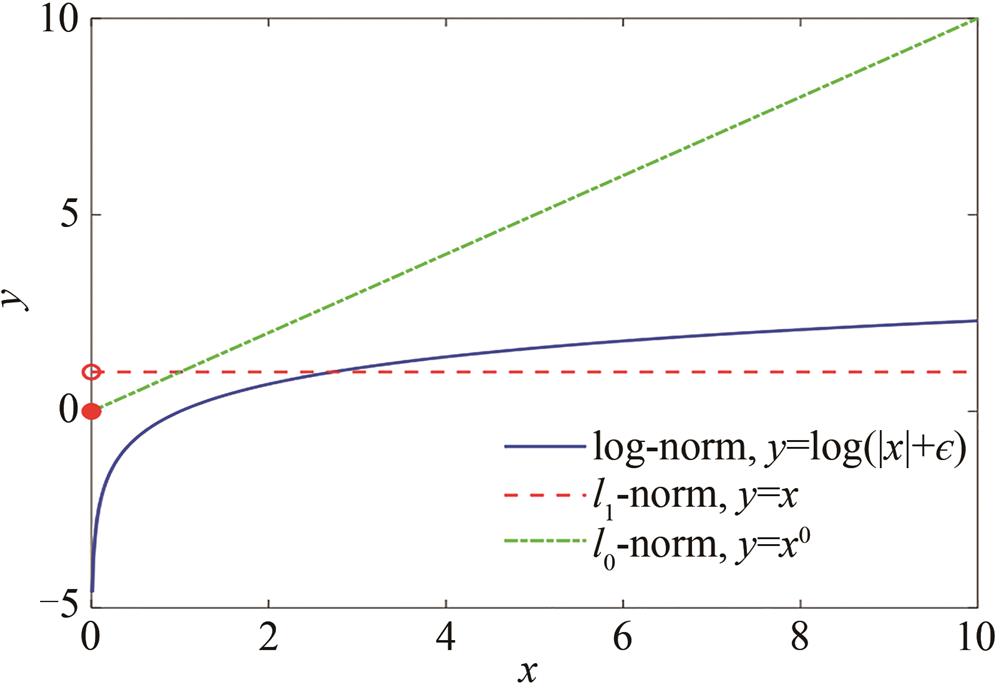
Fig. 1. Comparison of l0-norm,l1-norm and log function
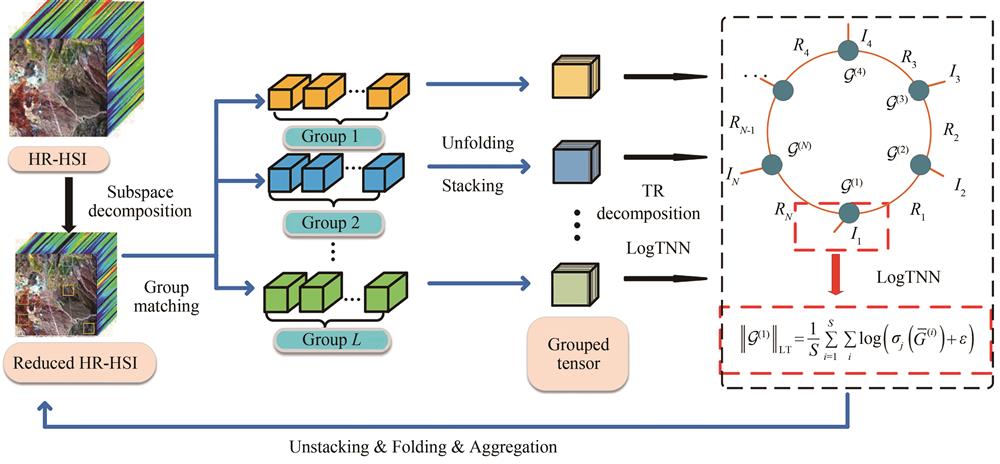
Fig. 2. Flowchart of the proposed method.
Fig. 3. Three data sets were used in the experiment
Fig. 4. Effect of different parameters R and
Fig. 5. The first line gives the visual comparison of the reconstruction results at the 21th band of the Curpriter Mine dataset,and the second line shows the related error images
Fig. 6. The PSNR values of five methods in different bands of three data sets are compared
Fig. 7. The first line gives the visual comparison of the reconstruction results at the 80th band of the Washington DC mall dataset,and the second line shows the related error image
Fig. 8. The first line gives the visualization comparison of reconstruction results at band 63 of Pavia City Center dataset,and the second line is the related error image
|
Table 1. The closed form solution for Eq.(12)
|
Table 2. Solution of LRTRLogTNN model via ADMM algorithm
| |||||||||||||||||||||||||||||||||||||||||||||||||||||||||||||||||||||||
Table 3. Quantitative evaluation results of all test methods in Cuprite Mine data set
| |||||||||||||||||||||||||||||||||||||||||||||||||||||||||||||||||||||||
Table 4. Quantitative evaluation index results of testing methods in Washington DC Mall data set
| |||||||||||||||||||||||||||||||||||||||||||||||||||||||||||||||||||||||
Table 5. Quantitative evaluation index results of testing methods in Pavia City Center data set
|
Table 6. Comparison results of running time by applying five test methods on Pavia City Center data set

Set citation alerts for the article
Please enter your email address
© Copyright 2018-2021 | Chinese Laser Press. All Rights Reserved 沪ICP备15018463号-20