
Xuejuan Wang, Haitong Wang, Leyan Hua, Lü Weitao, Lüwen Chen, Ying Ma, Qi Qi, Bin Wu, Weiqun Xu, Jing Yang, Qilin Zhang. Analysis on Lightning Spectral Characteristics of Canton Tower[J]. Acta Optica Sinica, 2023, 43(12): 1230001
- Acta Optica Sinica
- Vol. 43, Issue 12, 1230001 (2023)
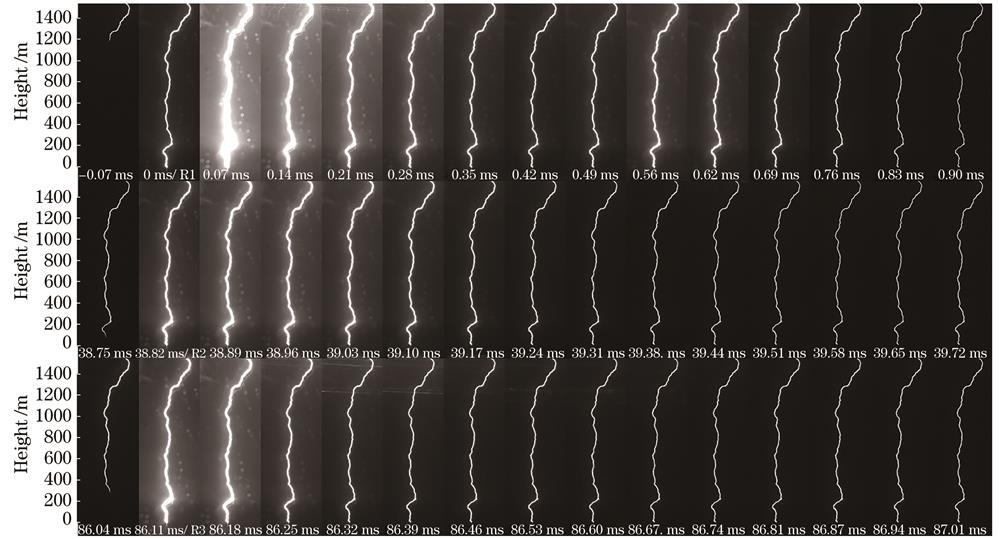
Fig. 1. Original luminous images of the discharge process
![Two-dimensional time-resolved spectrograms of three return strokes at channel height of about 337 m and magnified spectrograms of NI [856.8 nm, 859.4 nm, 862.9 nm] multiplet. (a) R1;(b) magnified spectrogram of NI [856.8 nm, 859.4 nm, 862.9 nm] multiplet for R1; (c) R2; (d) magnified spectrogram of NI [856.8 nm, 859.4 nm, 862.9 nm] multiplet for R2; (e) R3; (f) magnified spectrogram of NI [856.8 nm, 859.4 nm, 862.9 nm] multiplet for R3](/richHtml/gxxb/2023/43/12/1230001/img_02.jpg)
Fig. 2. Two-dimensional time-resolved spectrograms of three return strokes at channel height of about 337 m and magnified spectrograms of NI [856.8 nm, 859.4 nm, 862.9 nm] multiplet. (a) R1;(b) magnified spectrogram of NI [856.8 nm, 859.4 nm, 862.9 nm] multiplet for R1; (c) R2; (d) magnified spectrogram of NI [856.8 nm, 859.4 nm, 862.9 nm] multiplet for R2; (e) R3; (f) magnified spectrogram of NI [856.8 nm, 859.4 nm, 862.9 nm] multiplet for R3
Fig. 3. Three-dimensional time evolution spectrograms of three return strokes at channel height of about 337 m. (a) R1; (b) R2; (c) R3
Fig. 4. Original spectra of three return strokes. (a) R1,-0.07 ms; (b) R1,0 ms; (c) R1,0.07 ms; (d) R2,38.75 ms; (e) R2,38.82 ms;(f) R2,38.89 ms; (g) R3,86.04 ms; (h) R3,86.11 ms; (i) R3,86.18 ms
Fig. 5. Variations of the spectrogram along the channel height for each return stroke. (a) R1,0 ms; (b) R1,0.07 ms; (c) R1,0.14 ms; (d) R2,38.82 ms; (e) R2,38.89 ms; (f) R3,86.11 ms; (g) R3,86.18 ms
Fig. 6. Variations of total intensity of the spectra, total intensity of ionized lines, and total intensity of neutral lines along the channel height for each return stroke. (a) R1,0 ms; (b) R1,0.07 ms; (c) R1,0.14 ms; (d) R2,38.82 ms; (e) R2,38.89 ms;(f) R3,86.11 ms; (g) R3,86.18 ms
Fig. 7. Intensity ratios of measured spectral lines and the ratios of theoretical gA values within the NI [856.8 nm, 859.4 nm, 862.9 nm] multiplet. (a) NI 856.8/859.4 nm; (b) 856.8/862.9 nm; (c) 859.4 /862.9 nm
|
Table 1. Transition parameters of NI [856.8 nm, 859.4 nm, 862.9 nm] multiplet

Set citation alerts for the article
Please enter your email address
© Copyright 2018-2021 | Chinese Laser Press. All Rights Reserved 沪ICP备15018463号-20