
Xiao-yan LIU, Qian YANG, Qiao-jun LIU. Adaptability Analysis of Various Versions of GDPS Based on QA Score for GOCI Data Processing in the Yellow Sea[J]. Spectroscopy and Spectral Analysis, 2021, 41(7): 2233
- Spectroscopy and Spectral Analysis
- Vol. 41, Issue 7, 2233 (2021)
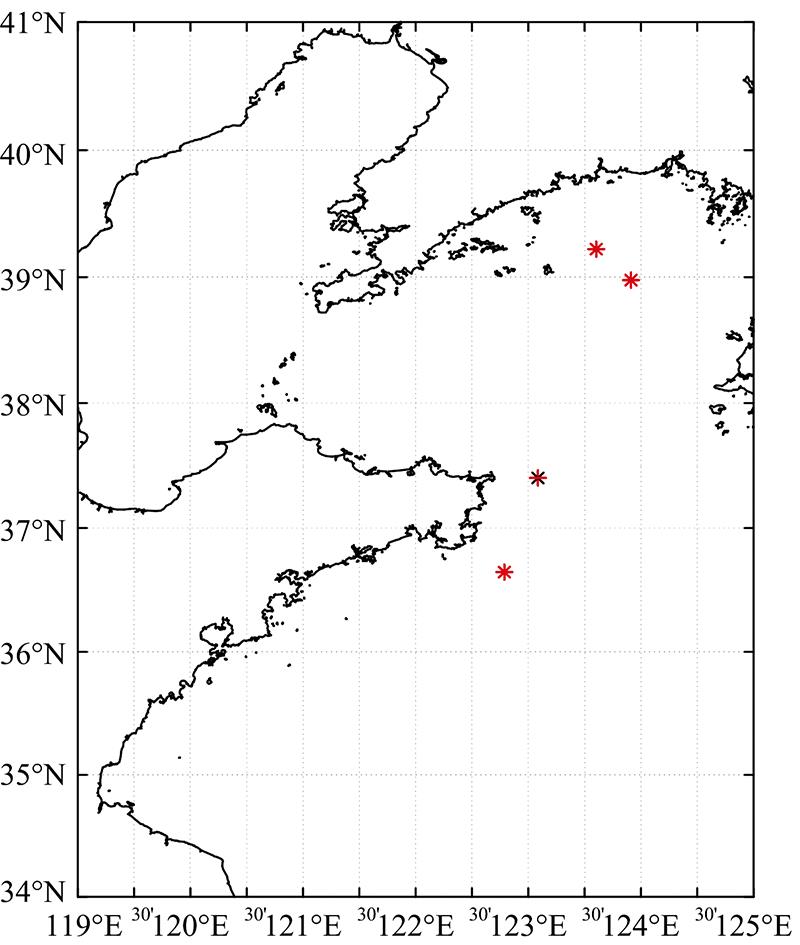
Fig. 1. The map of in-situ stations that matched with GOCI R rs data
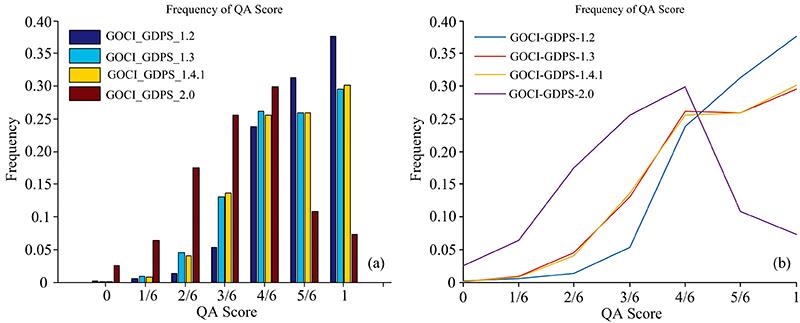
Fig. 2. Statistical probability distribution of QA score of GOCI R rs data processed by GDPS1.2, GDPS1.3, GDPS1.4.1 and GDPS2.0in Yellow Sea
(a): Histogram figure of QA score ofR rs date; (b): Graph figure of QA score of R rs date
(a): Histogram figure of QA score of
Fig. 3. Comparison analysis figures of R rs data obtained from GOCI data processed by GDPS1.2, GDPS1.3, GDPS1.4.1 and GDPS2.0 with the in-situ measured R rs data of four stations
The GOCI Rrs spectra obtained by GDPS1.3(green line) and GDPS1.4.1(blue line) are coincident (a), (b), (c), (d) correspond to the comparison results of the four stations from north to south inFigure 1 respectively
The GOCI Rrs spectra obtained by GDPS1.3(green line) and GDPS1.4.1(blue line) are coincident (a), (b), (c), (d) correspond to the comparison results of the four stations from north to south in
Fig. 4. (a) Comparison results between R rs values processed by four GDPS versions of 469nm and field measured data; (b) Comparison results between R rs values processed by four GDPS versions of 555 nm and field measured data; (c) Comparison results between R rs-chla obtained from R rs(469) and R rs(555) processed by four GDPS versions and R rs-chla data obtained from field measured data
Fig. 5. Distribution figures of GOCI R rs's QA score calculated by QA evaluation system in Yellow Sea (2015.08.27 04:16). The GOCI R rs data processed by GDPS1.2 (a), GDPS1.3 (b), GDPS1.4.1 (c) and GDPS2.0 (d) respectively
|
Table 1. Bands introduction of GOCI data
|
Table 2. The spectral relationship of each GOCI data band
| ||||||||||||||||||||||||||||||||||||||||||||
Table 3. R rs data's QA score distribution probability processed by four GDPS versions

Set citation alerts for the article
Please enter your email address
© Copyright 2018-2021 | Chinese Laser Press. All Rights Reserved 沪ICP备15018463号-20