• Chinese Physics B
  • Vol. 29, Issue 9, (2020)
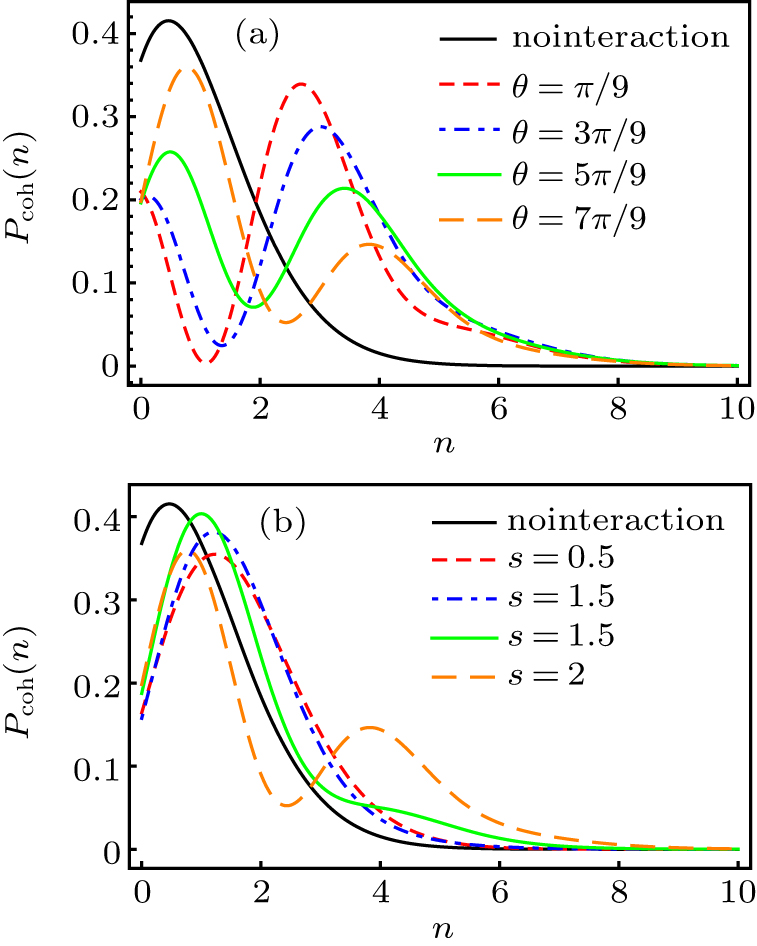
Yusuf Turek
Author Affiliations
  • School of Physics and Electronic Engineering, Xinjiang Normal University, Urumqi 830054, China
  • show less
    DOI: 10.1088/1674-1056/ab9f23 Cite this Article
    Yusuf Turek. Effects of postselected von Neumann measurement on the properties of single-mode radiation fields[J]. Chinese Physics B, 2020, 29(9): Copy Citation Text show less
    Photon distribution Pcoh(n) of coherent state as a function of photon number n for ϑ = π/3, φ = π/4, r = 1. (a) Pcoh(n) plotted for s = 2, and for various weak values (〈σx〉w = eiπ/3 tanθ/2) in the no interaction case (black curve). (b) Pcoh(n) plotted for θ = 7π/9, and for various coupling strength s.
    Fig. 1. Photon distribution Pcoh(n) of coherent state as a function of photon number n for ϑ = π/3, φ = π/4, r = 1. (a) Pcoh(n) plotted for s = 2, and for various weak values (〈σxw = eiπ/3 tanθ/2) in the no interaction case (black curve). (b) Pcoh(n) plotted for θ = 7π/9, and for various coupling strength s.
    Second-order correlation function gcoh(2)(0) and Mandel factor Qm,coh for the coherent state after postselected measurement. Here φ = 4π/5, ϑ = π/3. gcoh(2)(0) vs. coherent state parameter r for different interaction strength s (black sold line represents the initial coherent state |α〉) and for (a) θ = π/3, or (b) θ = 7π/9. The Mandel factor Qm,coh plotted as a function of the weak value for different r of coherent state and for (c) s = 0.2, or (d) s = 2.
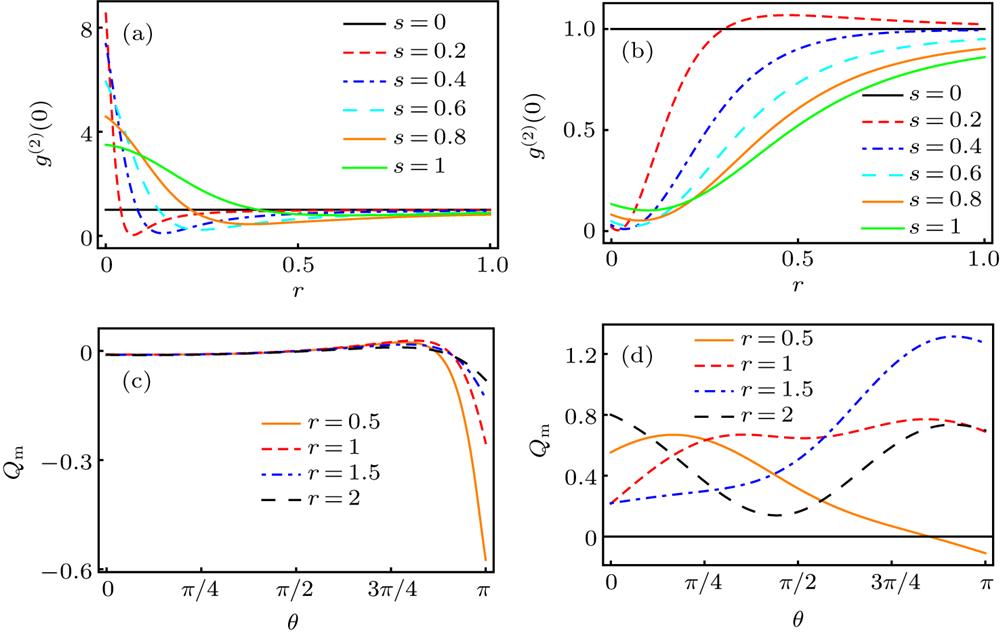
    Fig. 2. Second-order correlation function gcoh(2)(0) and Mandel factor Qm,coh for the coherent state after postselected measurement. Here φ = 4π/5, ϑ = π/3. gcoh(2)(0) vs. coherent state parameter r for different interaction strength s (black sold line represents the initial coherent state |α〉) and for (a) θ = π/3, or (b) θ = 7π/9. The Mandel factor Qm,coh plotted as a function of the weak value for different r of coherent state and for (c) s = 0.2, or (d) s = 2.
    The squeezing parameter Sϕ,coh for the coherent state after postselected measurement. Here φ = 4π/5, ϑ = π/3. Sϕ, coh vs. interaction strength s for various r and P quadrature of the coherent state (ϕ = π/2), but with different weak values: (a) θ = π/9, (b) θ = 7π/9. (c) Sϕ, coh plotted as a function of interaction strength s for various r and for θ = π/9, ϕ = 0 (represents the X quadrature of coherent state). (d) Sϕ, coh vs. coherent state parameter r for different weak values and for ϕ = π/2, s = 2.
    Fig. 3. The squeezing parameter Sϕ,coh for the coherent state after postselected measurement. Here φ = 4π/5, ϑ = π/3. Sϕ, coh vs. interaction strength s for various r and P quadrature of the coherent state (ϕ = π/2), but with different weak values: (a) θ = π/9, (b) θ = 7π/9. (c) Sϕ, coh plotted as a function of interaction strength s for various r and for θ = π/9, ϕ = 0 (represents the X quadrature of coherent state). (d) Sϕ, coh vs. coherent state parameter r for different weak values and for ϕ = π/2, s = 2.
    Photon distribution Psq(n) of squeezed vacuum state after postselected measurement as a function of n. Here δ = π/3, φ = π/3, η = 0.5. (a) Psq(n) is plotted for s = 1, and for the no interaction case (black curve) and various weak values. (b) Psq(n) is plotted for θ = 7π/9, and for various interaction strength s.
    Fig. 4. Photon distribution Psq(n) of squeezed vacuum state after postselected measurement as a function of n. Here δ = π/3, φ = π/3, η = 0.5. (a) Psq(n) is plotted for s = 1, and for the no interaction case (black curve) and various weak values. (b) Psq(n) is plotted for θ = 7π/9, and for various interaction strength s.
    Second-order correlation function gsq(2)(0) and the Mandel factor Qm,sq of the squeezed vacuum state after postselected measurement. Here φ = π/3, δ = π/3: (a) gsq(2)(0) vs. interaction strength s for different weak values and for η = 0.2; (b) gsq(2)(0) plotted as a function of squeezed vacuum state parameter η for various interaction strengths and for θ = 7π/9; (c) Qm,sq vs. interaction strength s for different weak values and for η = 0.2; (d) Qm,sq plotted as a function of squeezed vacuum state parameter η for various interaction strengths and for θ = 7π/9. Inset: the enlarged curves in the interval η∈[0,0.5].
    Fig. 5. Second-order correlation function gsq(2)(0) and the Mandel factor Qm,sq of the squeezed vacuum state after postselected measurement. Here φ = π/3, δ = π/3: (a) gsq(2)(0) vs. interaction strength s for different weak values and for η = 0.2; (b) gsq(2)(0) plotted as a function of squeezed vacuum state parameter η for various interaction strengths and for θ = 7π/9; (c) Qm,sq vs. interaction strength s for different weak values and for η = 0.2; (d) Qm,sq plotted as a function of squeezed vacuum state parameter η for various interaction strengths and for θ = 7π/9. Inset: the enlarged curves in the interval η∈[0,0.5].
    Squeezing parameter Sϕ,sq of the squeezed vacuum state after postselected measurement. Here φ = π/3. (a) Sϕ vs. η of the squeezed vacuum state for different interaction strength s and for δ = ϕ = 0, θ = π/9. (b) Sϕ,sq plotted as a function of ϕ for various interaction strength s and for η = 0.5,δ = π/3, and θ = π/9. Sϕ,sq vs. interaction strength s for different weak values and for δ = 0 and η = 0.5, but with different ϕ: (c) ϕ = 0, (d) ϕ=π2. Inset: the enlarged curves in the interval s ∈ (0,1].
    Fig. 6. Squeezing parameter Sϕ,sq of the squeezed vacuum state after postselected measurement. Here φ = π/3. (a) Sϕ vs. η of the squeezed vacuum state for different interaction strength s and for δ = ϕ = 0, θ = π/9. (b) Sϕ,sq plotted as a function of ϕ for various interaction strength s and for η = 0.5,δ = π/3, and θ = π/9. Sϕ,sq vs. interaction strength s for different weak values and for δ = 0 and η = 0.5, but with different ϕ: (c) ϕ = 0, (d) ϕ=π2. Inset: the enlarged curves in the interval s ∈ (0,1].
    Photon distribution Psh(n) of the squeezed state as a function of photon number n. Here δ = π/3, φ = π/3, ω = 0, r = 0.5: (a) Psh(n) is plotted for s = 1, and for various weak values; (b) Psh(n) is plotted for θ = 7π/9, and for various interaction strength s.
    Fig. 7. Photon distribution Psh(n) of the squeezed state as a function of photon number n. Here δ = π/3, φ = π/3, ω = 0, r = 0.5: (a) Psh(n) is plotted for s = 1, and for various weak values; (b) Psh(n) is plotted for θ = 7π/9, and for various interaction strength s.
    Second-order correlation function gsh(2)(0) and Mandel factor Qm,sh of the Schrödinger state after postselected measurement. Here φ = 0, δ = 0: (a) gsh(2)(0) plotted as a function ω of the Schrödinger cat state for various interaction strength s and for θ = π/9, r = 0.3; (b) gsh(2)(0) vs. parameter r of the Schrödinger cat state for different weak values and for s = 0.5, ω = ω; (c) Qm,sh plotted as a function ω of the Schrödinger cat state for various interaction strength s and for θ = π/9, r = 0.3; (d) Qm,sh vs. parameter r of the Schrödinger cat state for different weak values and for s = 0.5, ω = π.
    Fig. 8. Second-order correlation function gsh(2)(0) and Mandel factor Qm,sh of the Schrödinger state after postselected measurement. Here φ = 0, δ = 0: (a) gsh(2)(0) plotted as a function ω of the Schrödinger cat state for various interaction strength s and for θ = π/9, r = 0.3; (b) gsh(2)(0) vs. parameter r of the Schrödinger cat state for different weak values and for s = 0.5, ω = ω; (c) Qm,sh plotted as a function ω of the Schrödinger cat state for various interaction strength s and for θ = π/9, r = 0.3; (d) Qm,sh vs. parameter r of the Schrödinger cat state for different weak values and for s = 0.5, ω = π.
    Squeezing parameter Sϕ, sh of the Schrödinger cat state. Here φ = 0, δ = 0, r = 0.3. Sϕ, sh of the even Schrödinger cat state (ω = 0) vs. the squeezing parameter angle ϕ for different interaction strength and for θ = π/9 in (a); for different weak values and for s = 0.5 in (b). (c) Sϕ, sh plotted as a function of ω for various weak values and for s = 0.5, ϕ = π/2. (d) Sϕ, sh of the odd Schrödinger cat state (ω = π) vs. the squeezing parameter angle ϕ for different interaction strength and for θ = π/9.
    Fig. 9. Squeezing parameter Sϕ, sh of the Schrödinger cat state. Here φ = 0, δ = 0, r = 0.3. Sϕ, sh of the even Schrödinger cat state (ω = 0) vs. the squeezing parameter angle ϕ for different interaction strength and for θ = π/9 in (a); for different weak values and for s = 0.5 in (b). (c) Sϕ, sh plotted as a function of ω for various weak values and for s = 0.5, ϕ = π/2. (d) Sϕ, sh of the odd Schrödinger cat state (ω = π) vs. the squeezing parameter angle ϕ for different interaction strength and for θ = π/9.
    Yusuf Turek. Effects of postselected von Neumann measurement on the properties of single-mode radiation fields[J]. Chinese Physics B, 2020, 29(9):
    Download Citation