
Pan LIU, Mi-fang DU, Zhi-ya LI, Ling-qing GAO, Hua-yun HAN, Xin-yao ZHANG. Determination of Trace Tellurium Content in Steel by Hydride Generation Atomic Fluorescence Spectrometry[J]. Spectroscopy and Spectral Analysis, 2022, 42(10): 3103
- Spectroscopy and Spectral Analysis
- Vol. 42, Issue 10, 3103 (2022)
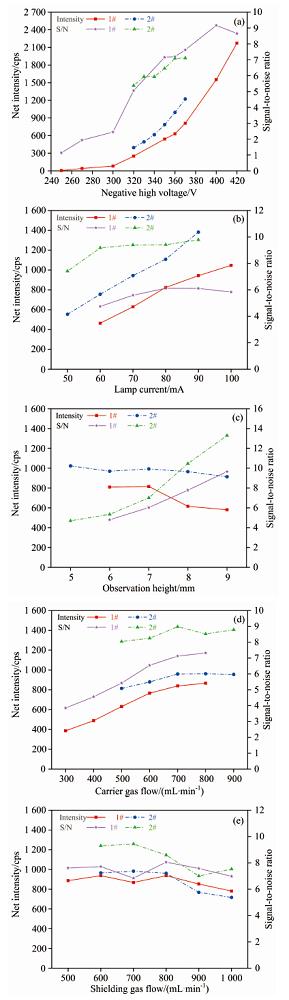
Fig. 1. Effect of spectral working parameters on fluorescence intensity and signal-to-noise ratio
(a): Negative high voltage; (b): Lamp current; (c): Observation height; (d): Carrier gas flow; (e): Shielding gas flow
(a): Negative high voltage; (b): Lamp current; (c): Observation height; (d): Carrier gas flow; (e): Shielding gas flow
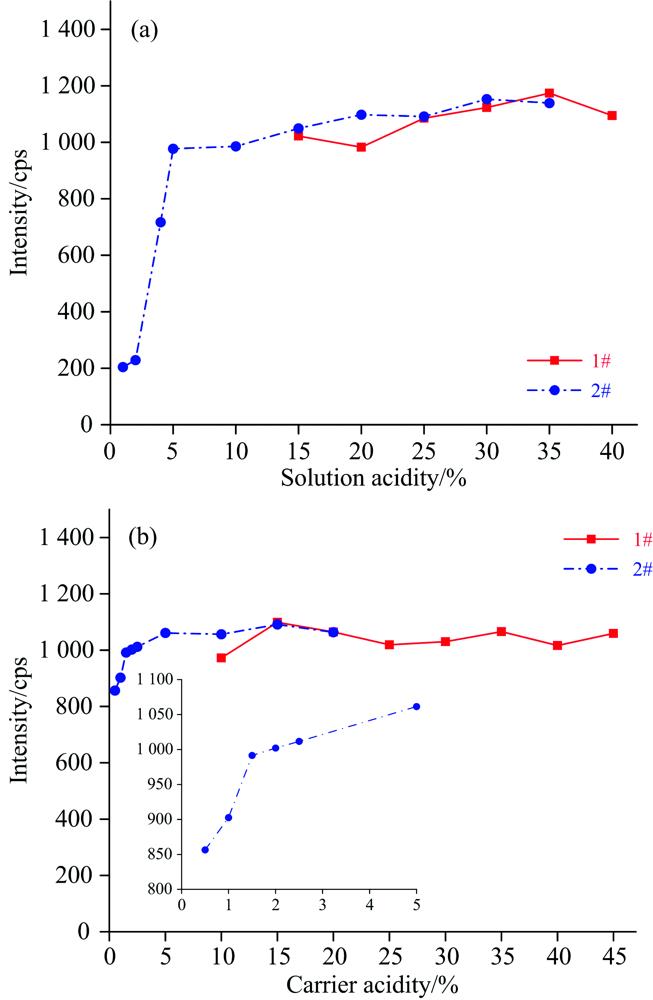
Fig. 2. Effect of acidity in solution on fluorescence intensity
(a): Solution; (b): Carrier
(a): Solution; (b): Carrier
Fig. 3. Effect of potassium borohydride concentration on fluorescence intensity
Fig. 4. Effect of iron matrix on fluorescence intensity
Fig. 5. Effect of coexisting ions on the determination of tellurium
(a): Chromium; (b): Nickel; (c): Manganese; (d): Copper; (e): Molybdenum; (f): Tungsten; (g): Titanium; (h): Silicon; (i): Vanadium
(a): Chromium; (b): Nickel; (c): Manganese; (d): Copper; (e): Molybdenum; (f): Tungsten; (g): Titanium; (h): Silicon; (i): Vanadium
Fig. 6. Calibration curve
|
Table 1. Determination results of tellurium in synthetic sample

Set citation alerts for the article
Please enter your email address
© Copyright 2018-2021 | Chinese Laser Press. All Rights Reserved 沪ICP备15018463号-20