
Meng Zhang, Yuxi Chu, Jun Zhao, Dongyu Yan, Yongzhi Li, Genyu Bi, Bowen Liu, Minglie Hu. Efficient generation of third harmonics in Yb-doped femtosecond fiber laser via spatial and temporal walk-off compensation[J]. Chinese Optics Letters, 2021, 19(3): 031402
- Chinese Optics Letters
- Vol. 19, Issue 3, 031402 (2021)
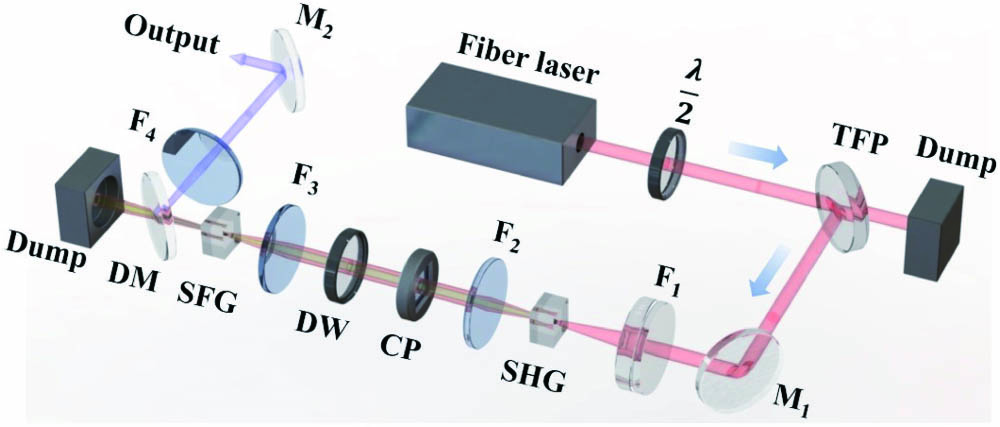
Fig. 1. Experimental setup.
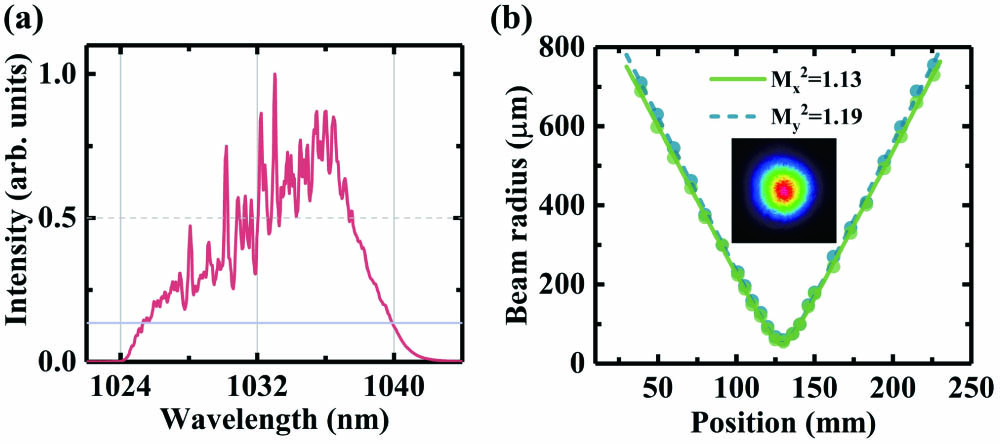
Fig. 2. (a) Spectrum and (b) M2 factors of Yb-doped femtosecond fiber laser; the inset in (b) is the near-field beam profile.
Fig. 3. (a) Average output power and conversion efficiency of the SH beam as functions of the fundamental power. Inset, the near-field beam profile of the SH beam at maximum average power output. (b) Spectrum, (c)
Fig. 4. (a) Spatial and temporal walk-off effects and their optimization using a CP. Red, fundamental pulses; green, SH pulses; violet, UV pulses. (b) Group refractive index curves of SH (blue curves) and fundamental (red curves) beams including
Fig. 5. Experimental results of SFG. (a) UV output power for different CPs with different focusing lenses. (b) UV output power and conversion efficiency as functions of the fundamental power. Inset, near-field beam profile of the UV beam at maximum average output power. (c) UV spectrum at maximum average output power. (d) UV output power for different CPs with f2 = f3
Fig. 6. (a) UV output power and conversion efficiency as functions of the fundamental power using the conventional delay line. Inset, near-field beam profile of the UV beam at maximum average output power. (b) Power stability tests of the CP and conventional delay line, respectively, for 6 h.
|
Table 1. Delay Time between Green and Pump Beams
| |||||||||||||||||||||||||||||||||||
Table 2. Key Parameters of CPs

Set citation alerts for the article
Please enter your email address
© Copyright 2018-2021 | Chinese Laser Press. All Rights Reserved 沪ICP备15018463号-20